Dawn Harrington’s post not only demonstrates the implementation of true/false highlighting, but also highlights its versatility and potential applications across various data visualisation scenarios. From highlighting outliers in financial data to emphasising key performance indicators in business analytics, this technique offers a wide range of possibilities for enhancing data interpretation. By incorporating true/false highlighting into your Tableau dashboards, readers can effectively communicate insights and facilitate better decision-making processes within their organisations.
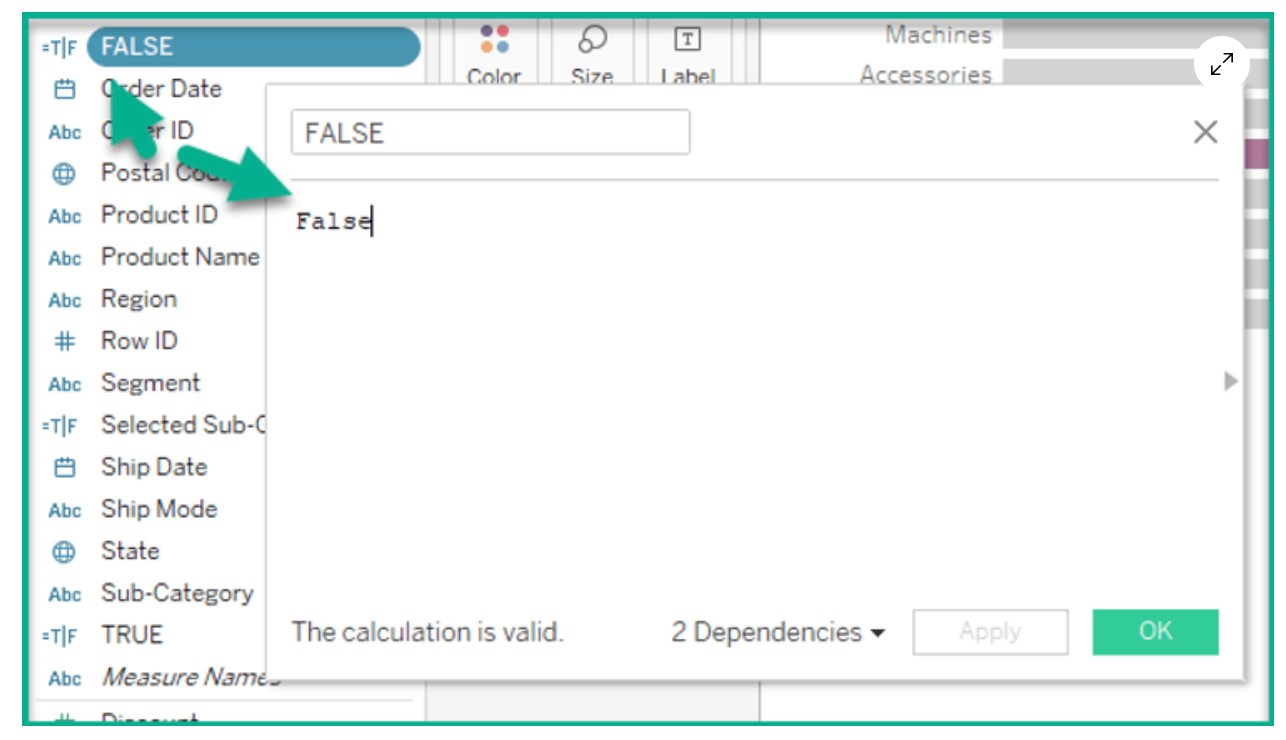

Tableau Training on
Tap Fast Track

Tableau Advanced Analyst

Tableau
Foundation

