Tableau Desktop Training - Analyst
For Private options, online or in-person, please send us details of your requirements:

Public Course Options
BE UP AND RUNNING WITH TABLEAU IN DAYS, NOT WEEKS

Public Course Options
BE UP AND RUNNING WITH TABLEAU IN DAYS, NOT WEEKS
Training
- 2 Day live virtual course
- 12 month access to e-learning
- 4 half day sessions
- Regular schedule
Express Hybrid
- 1 week self-paced online learning
- Live introduction
- 2 live Q&A sessions
- New intake starts each week
flexi Hybrid
- 4 week self-paced online learning
- Live introduction
- 5 live Q&A sessions
- New intake starts each week
This Tableau Desktop training intermediate course is designed for the professional who has a solid foundation with Tableau and is looking to take it to the next level. Attendees should have a good understanding of the fundamental concepts of building Tableau worksheets and dashboards typically achieved from having attended our Tableau Desktop Foundation Course.
At the end of this course you will be able to communicate insights more effectively, enabling your organisation to make better decisions, quickly.
The Tableau Desktop Analyst training course is aimed at people who are used to working with MS Excel or other Business Intelligence tools and who have preferably been using Tableau already for basic reporting.
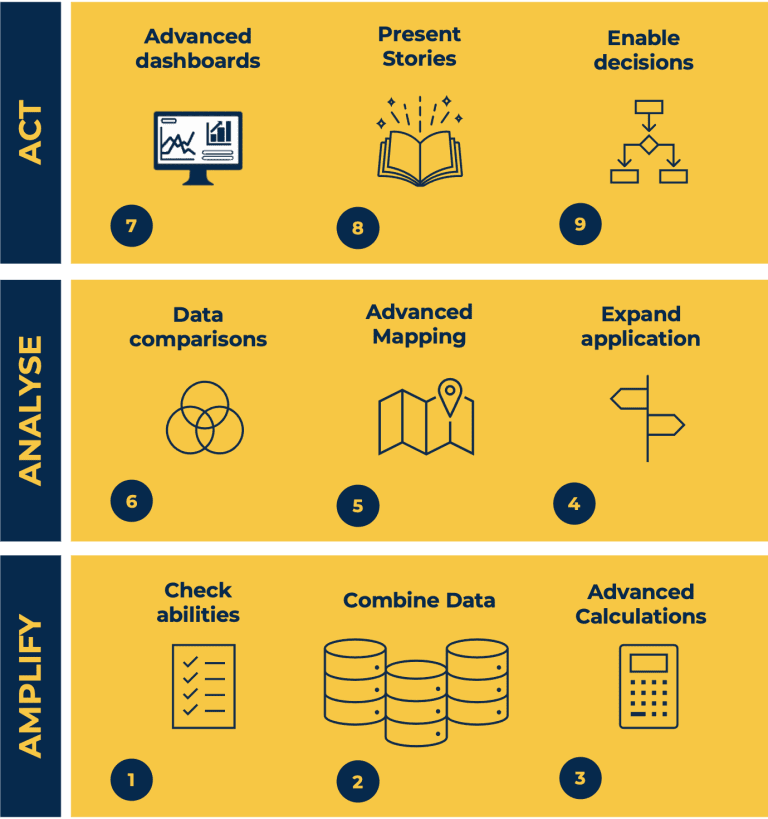
The course is split into 3 phases and 9 modules:
Phase 1: AMPLIFY
Module 1: Check Abilities
- Revision – What I Should Know
- What is possible
- How does Tableau deal with data
- Know your way around
- How do we format charts
- How Tableau deals with dates
- Charts that compare multiple measures
- Creating Tables
Module 2: Combine Data
- Relationships
- Joining Tables – Join Types, Joining tables within the same database, cross database joins, join calculations
- Blending – How to create a blend with common fields, Custom defined Field relationships and mismatched element names, Calculated fields in blended data sources
- Unions – Manual Unions and mismatched columns, Wildcard unions
- Data Extracts – Creating & Editing Data extracts
Module 3: Advanced Calculations
- Row Level v Aggregations
- Aggregating dimensions in calculations
- Changing the Level of Detail (LOD) of calculations – What, Why, How
- Adding Table Calculations
Phase 2: ANALYSE
Module 4: Expand Application
- Making things dynamic with parameters
- Sets
- Trend Lines
- How do we format charts
- Forecasting
Module 5: Advanced Mapping
- Using your own images for spatial analysis
- Mapping with Spatial files
Module 6: Data Comparisons
- Advanced Charts
- Bar in Bar charts
- Bullet graphs
- Creating Bins and Histograms
- Creating a Box & Whisker plot
Phase 3: ACT
Module 7: Advanced Dashboards
- Using the dashboard interface and Device layout
- Dashboard Actions and Viz In tooltips
- Horizontal & Vertical containers
- Navigate between dashboards
Module 8: Present Stories
- Telling data driven stories
Module 9: Enable Decisions
- What is Tableau Server
- Publishing & Permissions
- How can your users engage with content
This training course includes over 25 hands-on exercises and quizzes to help participants “learn by doing” and to assist group discussions around real-life use cases. Each attendee receives a login to our extensive training portal which covers the theory, practical applications and use cases, exercises, solutions and quizzes in both written and video format.
Students must bring their own laptop with an active version of Tableau Desktop 2018.2 (or later) pre-installed.

