Tableau Novice to Best In Class Dashboards in 12 weeks Bootcamp
£99
This Bootcamp lasts for 12 weeks and has weekly activities and exercises designed to help you succeed.
We have also included video’s that were recorded live from our Beta program that will also further your learning. The interaction and questions from the Beta have ensured that this Online-Only course covers all of the most common issues that may be encountered.
You will receive weekly updates advising you of which material will be released to you in that week, as well as progress updates detailing which content you should aim to complete in that week.
The Summer Bootcamp will cost you just £99 and includes Bonus’s worth £1,530 as a massive “Thank YOU” for helping us shape the online-only version correctly.
TABLEAU NOVICE TO BEST IN CLASS DASHBOARDS IN 12 WEEKS PROGRAM
This course will be delivered as an online course, with email support and includes all of the following elements.
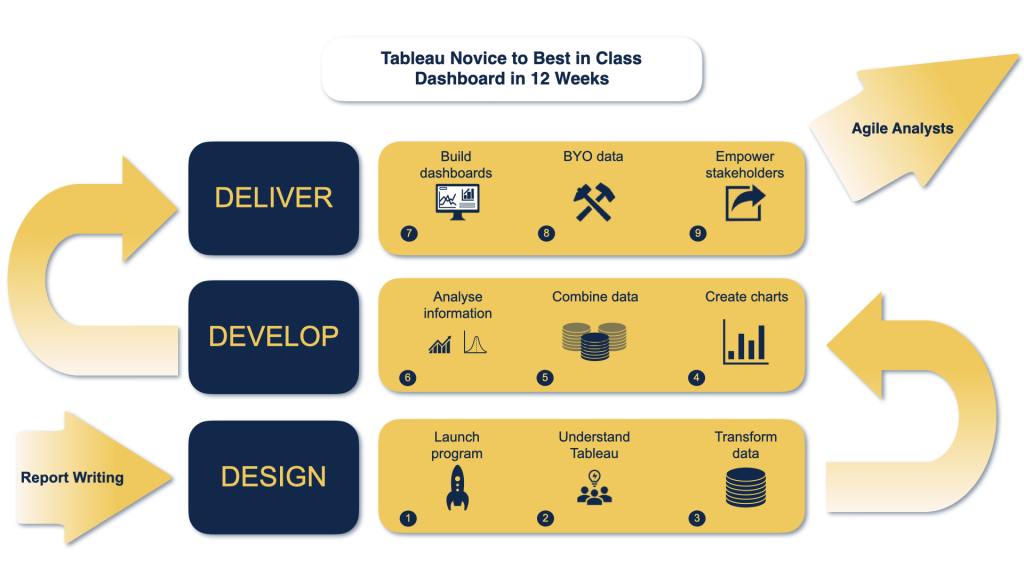
- Access to all 9 Modules of TToT™️ (Tableau Training on Tap) that transforms you from reporting squirrel to agile analyst
- Weekly theory, drip fed
- See below for the syllabus
- The TToT Development Process™️:
- Delivers solutions that reduce ad-hoc requests by meeting users needs quicker
- Enables On-Time delivery
- Significantly reduces scope creep
- Maintains stakeholder engagement throughout
- Ensures your users get the most from your dashboards
- Exercises for all of the most common tasks in Tableau
- Step by step written instructions
- Video walk through of each solution
- Exercises scheduled daily, in manageable bite-sized chunks
- Join our Active community – lifetime membership
- LinkedIn Group to ask each other questions and share resources
- Engage and collaborate with people on the same journey as you
- Daily, Real World use case links to tips and tricks
- Walk through of how to use chart templates to save time, improve functionality and deliver quicker insights
- Walk thorough of common use cases across multiple industries and functions
- Weekly email progress checkpoint
- How to get the best from Google searches
- Top 10 ways to make great charts that WoW your users whilst improving readability for users who are not trained in data visualization or data literacy
- Get the Excel out of here – how to switch from things you do in Excel to doing them quickly in Tableau
- Guided tour of the top 5 resources to help avoid performance issues in Tableau
- Top tips for using Dashboard containers to build dashboards quicker without spending ages making changes to layouts
- A 90 day planning process to implement what you’ve learnt and to plan in more productivity improvements
- 12 Months access to all the online content and recording of the live sessions.
HOW MUCH OF YOUR TIME WILL THIS TAKE?
If you play full on and participate in every session and apply every exercise to your own data? We estimate it will be an investment of about an hour each working day during the 12 weeks if you are an absolute beginner. Less if you are already using Tableau.
And if you have more time available? You will end up with a deeper learning experience and more results – and that is dashboards built to meet your needs, with our guidance.
If you take some days out, you should be able to play during or after the bootcamp, as you will have ongoing access to the material for 12 months.
⏭ The end result will be a Dashboard that you deliver, on your own data, that drills down to answer the root-cause questions.
You will be actively encouraged, on a weekly basis, to apply the exercises to your own data and use cases for a deeper learning experience.
The full syllabus you cover is below.
SUMMER BOOTCAMP BETA ATTENDEES ADDITIONAL BONUS'S
For attending the Beta program, that runs from 8th August live for 4 weeks, you also get the following bonus’s absolutely free (as a massive thank you for helping us create the perfect online bootcamp course for release later this year).
- The Daily Live Tableau Art Of The Possible Guided Tour – WORTH £300
- Sessions will be run twice a day to cater for people in different time zones:
- 08:30 British Summer Time (13:00 India Standard Time)
- 16:30 British Summer Time (08:30 Pacific Time; 11:30 Eastern Time)
- All sessions will be recorded and made available within 24 hours
- The Instant Dashboard Starter Template Pack – WORTH £200
- The Quickfire Real-World-Issues Troubleshooting Support Program for 1 month – WORTH £200
- Answered in Live sessions, by email, by Zoom or by Loom.
- Address questions on the theory
- Ask questions on applying the theory to your own data and use cases
THE TOTAL BONUS VALUE IS £1,530 ($1,840)
- The Desktop specialist Skills Checklist and study guide – WORTH £200
- The Find My Problem Tableau Terminology Glossary for Google & Forum Searches – WORTH £25
- The Top 3 Time Saving Extensions Guided Tour & 6 weeks free trial – WORTH £580
- The Best Advanced Chart Templates Resource Cheat Sheet – WORTH £25
- Peer reviews of your work – PRICELESS
THE SYLLABUS
WELCOME
- Welcome & Introduction
- Why is Visual Analytics important?
- Deliverables
- Test Drive the Platform
- Housekeeping
- Your First Assignment
PHASE 1: DESIGN
MODULE 1: UNDERSTAND TABLEAU
- What is possible
- How does Tableau deal with data
- Know your way around
- Review of Type Conversions
- Know your way around
- How do we format charts
- Dashboard basics – My first Dashboard
MODULE 2: TRANSFORM DATA
- Connecting to and setting up data in Tableau
- Modifying data attributes
- How Do I Structure my Data – Groups & Hierarchies, Visual Groups
- How Tableau Deals with Dates – Using Discrete and Continuous Dates, Custom Dates
- How do I create calculated fields and why? – Creating Calculated Fields, Types of calculated fields, Row Level v Aggregations, Aggregating dimensions in calculations, Changing the Level of Detail (LOD) of calculations – What, Why, How
MODULE 3: GATHER REQUIREMENTS
- Brainstorm and assess possible priorities
- Pitfalls to avoid
- Gather requirements
PHASE 2: DEVELOP
MODULE 4: CREATE CHARTS
- Charts that Compare Multiple Measures – Measure Names and Measure Values, Shared Axis Charts, Dual Axis Charts, Scatter Plots
- Showing progress over time
- Creating Tables – Creating Tables, Highlight Tables, Heat Maps
- Showing Relational & Proportional Data – Pie Charts, Donut Charts, Tree Maps
- Making things dynamic with parameters
MODULE 5: COMBINE DATA
- Relationships
- Joining Tables – Join Types, Joining tables within the same database, cross database joins, join calculations
- Blending – How to create a blend with common fields, Custom defined Field relationships and mismatched element names, Calculated fields in blended data sources
- Unions – Manual Unions and mismatched columns, Wildcard unions
- Data Extracts – Creating & Editing Data extracts
MODULE 6: ANALYSE INFORMATION
- Table Calculations
- Sets, Reference Lines, Trends and Forecasting
- Answering spatial questions – Mapping, Creating a choropleth (filled) map, Using your own images for spatial analysis, Mapping with spatial files
- Advanced charts
- Bar in Bar charts
- Bullet graphs
- Creating Bins and Histograms
- Creating a Box & Whisker plot
- Viz in Tooltips
PHASE 3: DESIGN
MODULE 7: BUILD DASHBOARDS
- Using the Dashboard Interface
- Device layouts
- Dashboard Actions – Set actions, Parameter actions
- Viz in Tooltips for Dashboards
- Dashboard containers – Horizontal & Vertical containers, Hidden containers
- Navigate between dashboards
- Telling data driven stories
MODULE 8: BRING YOUR OWN DATA
- Design
- Best Practices & Resources
- Wireframe templates
- Questions
- Process
- Start building and testing
MODULE 9: EMPOWER STAKEHOLDERS
- What is Tableau Server
- Publishing & permissions
- How can your users engage with content
- The Tableau ecosystem
- Review your progress
- Your next steps
