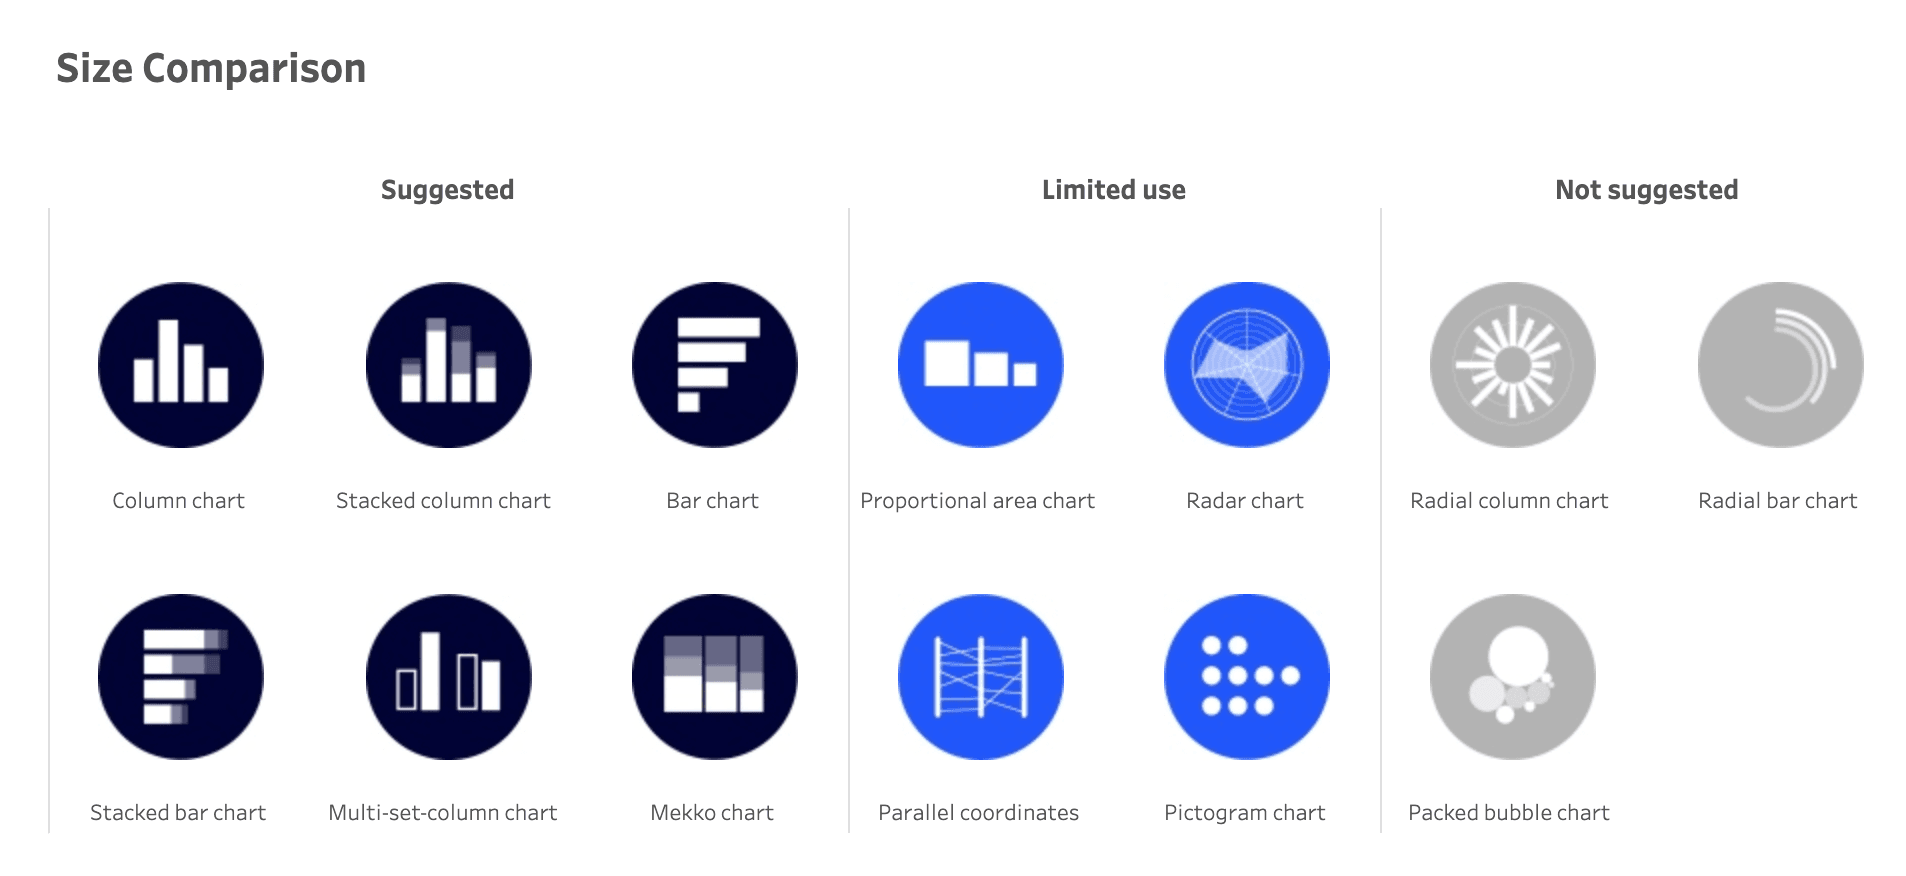
Andy Kriebel’s post shows us the various chart types available – offering practical insights into when and why to use each one. From bar charts to heat maps, the article covers it all! It’s the ultimate guide to making your visualisations more effective – whether you’re presenting trends, comparisons, or distributions.
Andy’s guide will empower you to make smarter visualisation choices – ensuring your audience can easily interpret the story your data tells. If you’ve ever struggled with selecting the right chart or want to elevate your Tableau game, this resource will sharpen your skills and boost the clarity of your dashboards. Read on today!


