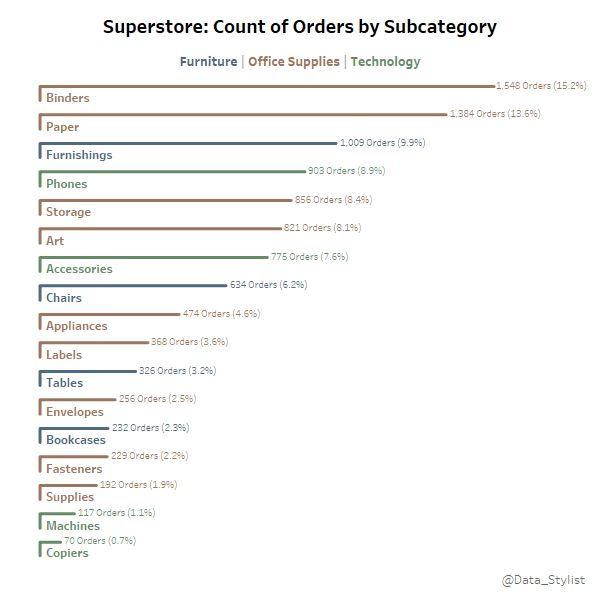
This unique twist on the traditional bar chart adds a new dimension to your visualisations – helping you communicate data more effectively while catching your audience’s attention. Sarah Pallett walks through the process of creating these.
Beyond aesthetics, Sarah highlights the practical benefits of L-shaped bars, which provide more clarity in comparing values – especially in complex datasets. Whether you’re a Tableau enthusiast or just looking to try something new with your data visualisations, this post will inspire you to think outside the box and transform your standard bar charts into something much more impactful.


