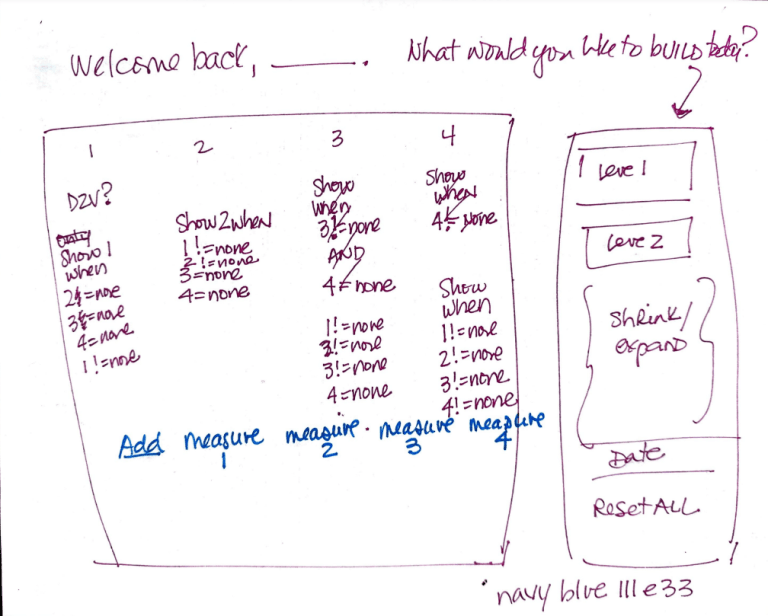
Sarah Pallett‘s blog post takes us through the entire process of designing a customisable crosstab dashboard – from initial sketches to the final build. She highlights how to implement key features like parameters and dynamic zone visibility, empowering viewers to tailor their experience based on their preferences.
Sarah shares her journey of transforming user feedback into a functional solution – making it a relatable read for anyone interested in improving their data visualisation skills. Her article provides actionable insights that can help you elevate your Tableau dashboards – ensuring they are both intuitive and engaging. Read on today!


