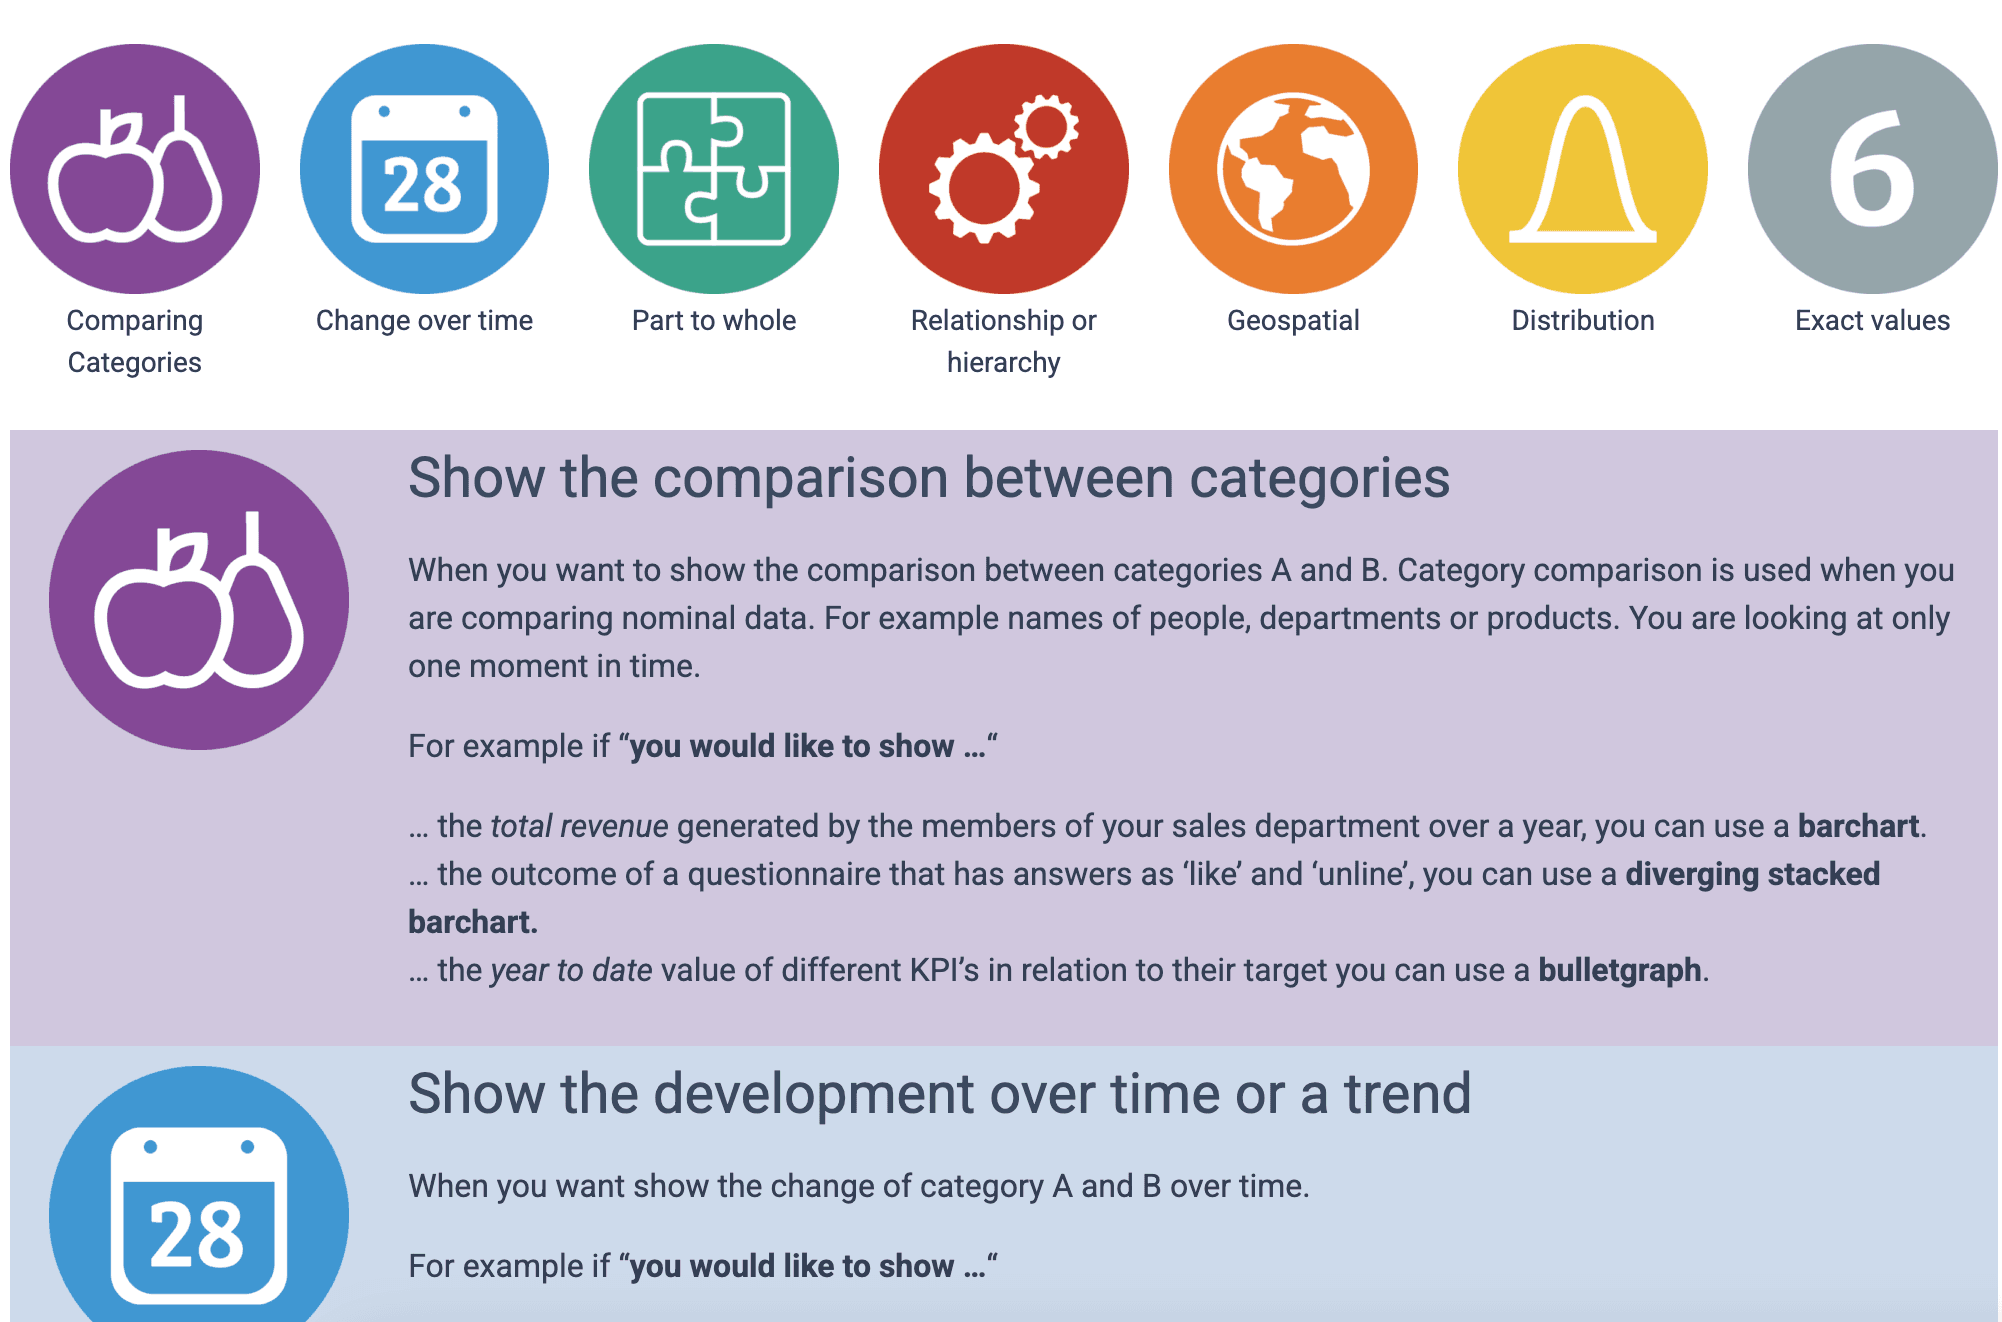
Selecting the right chart for your data is crucial for clear and effective communication, and this guide from Chart Guide is the perfect resource to help you make the best choice. It breaks down how different chart types work, when to use them, and common mistakes to avoid, ensuring your data is always presented in the most impactful way. Working with comparisons, trends, distributions, or relationships, this guide simplifies the decision-making process so you can create visuals that truly tell a story.
A well-chosen chart can enhance understanding, drive insights, and even influence decisions, while the wrong one can lead to confusion or misinterpretation. This guide is a must-read for analysts, designers, and business professionals who want to improve their data storytelling skills.


