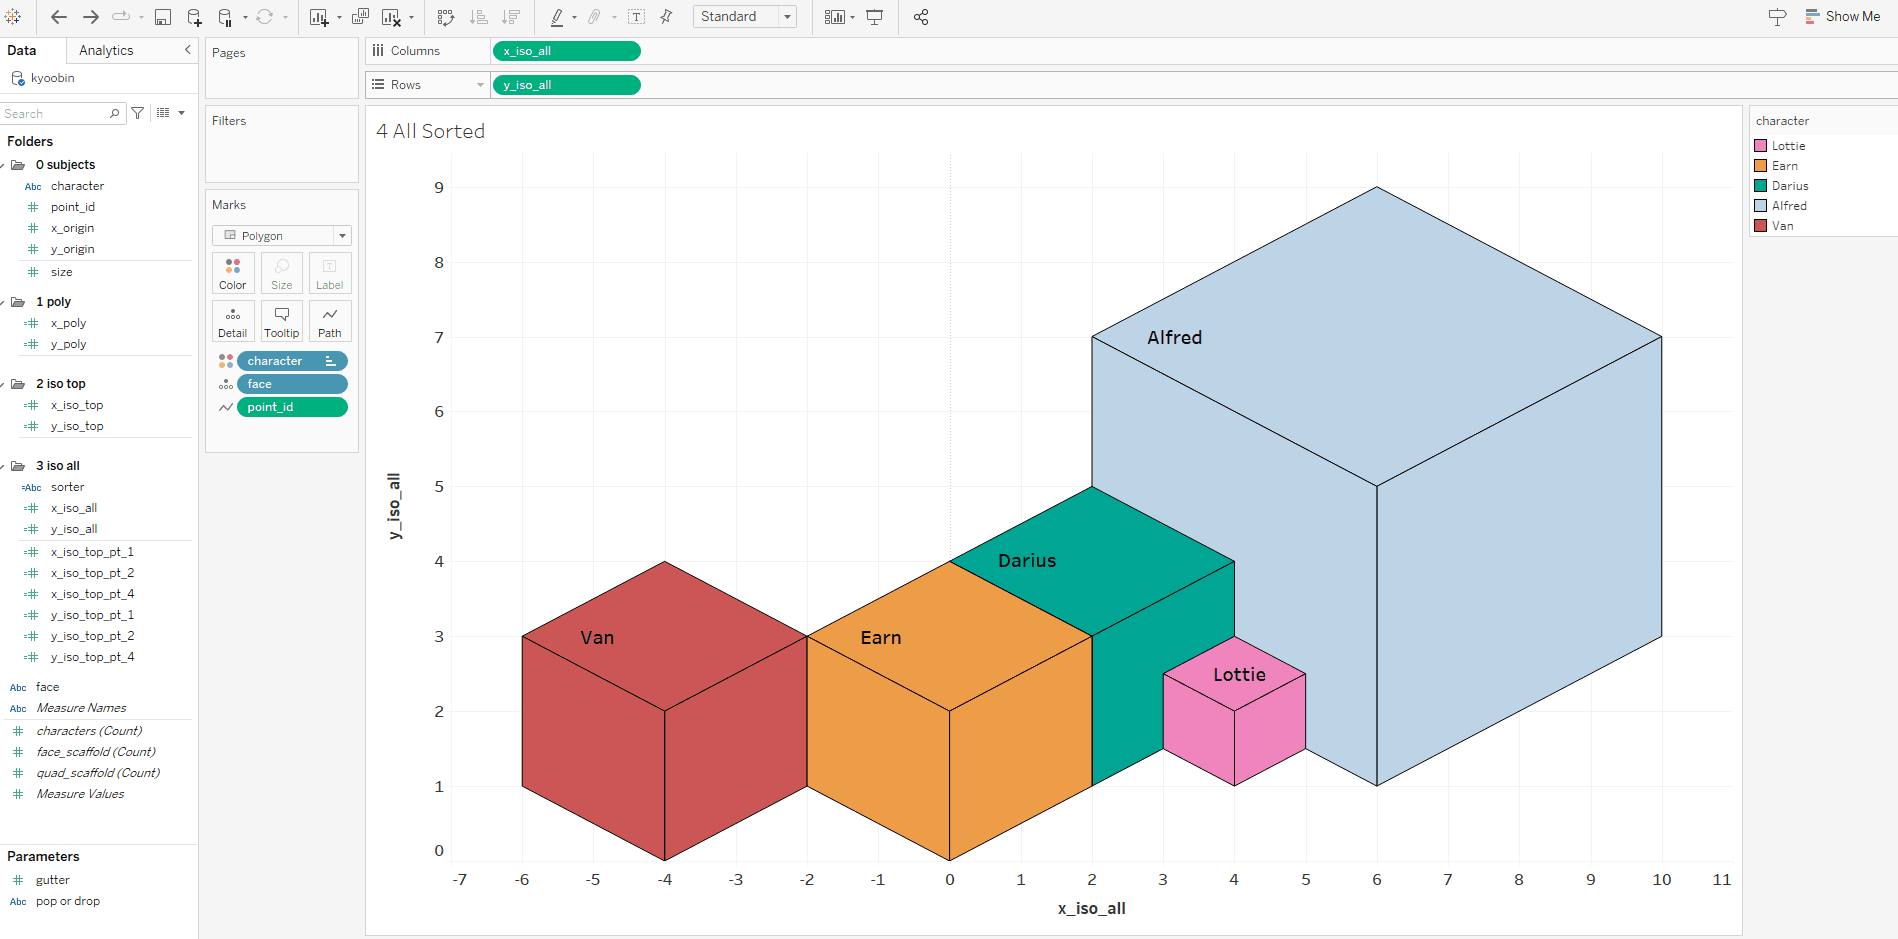
This insightful article, with CJ Mayes and Matt Antoline explores how to create stunning isometric charts, adding a 3D-like perspective that enhances data storytelling without compromising clarity. Step beyond traditional bar and line charts and make your dashboards more engaging and visually unique.
Discover when and where to use them effectively, ensuring they add value rather than unnecessary complexity to your dashboards. Whether you’re aiming to impress stakeholders, explore new visualisation techniques, or simply challenge yourself with a fresh approach, this tutorial will provide the inspiration and guidance you need.


