Serena Purslow provides a practical use case – tracking the change between two measures and shows how to visually represent this with colour-coded indicators or icons based on the sign of the result. Check out her post today!
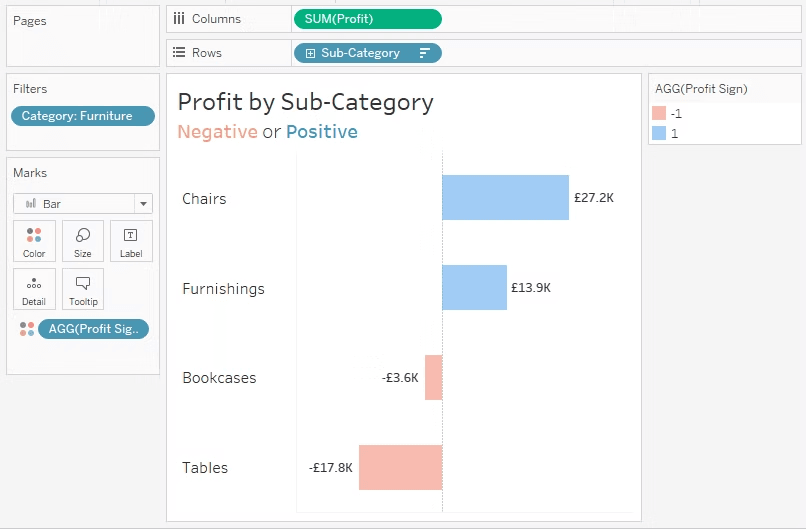

Tableau Training on
Tap Fast Track

Tableau Advanced Analyst

Tableau
Foundation

