Great visualisation isn’t just about following rules – it’s about knowing when to bend them. Through clear examples, Robert Kosara demonstrates how bar charts maintain clarity and accuracy in such cases. He cautions against using line charts for categorical data, as they can mislead by implying continuity where none exists. Read on today!
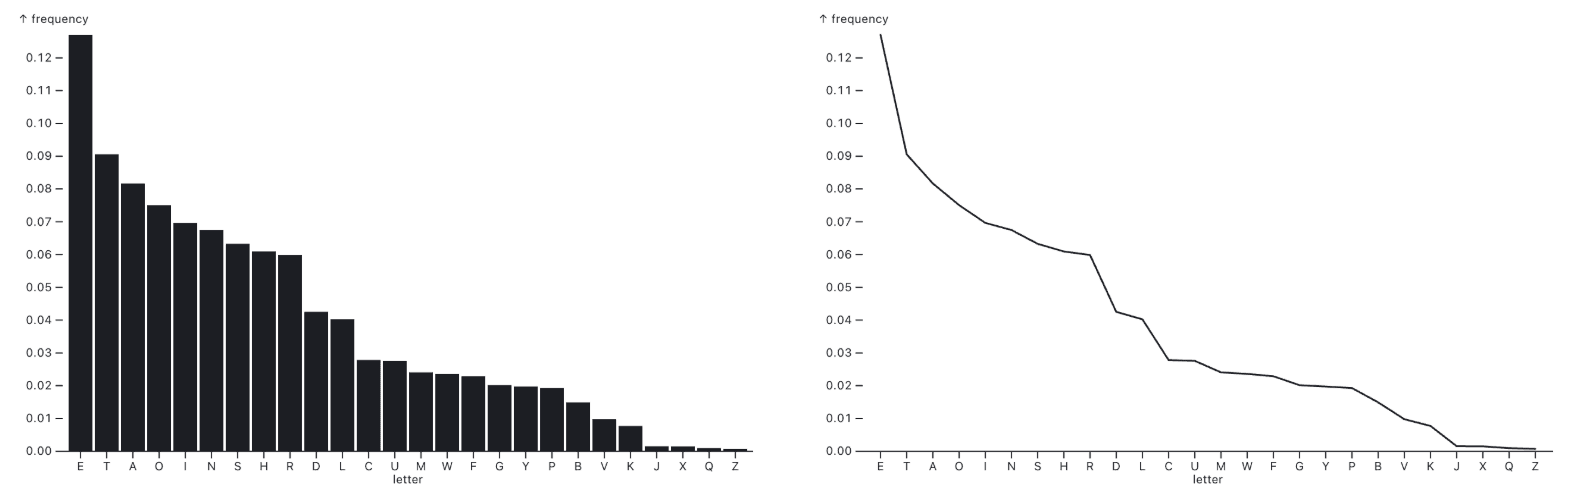

Tableau Training on
Tap Fast Track

Tableau Advanced Analyst

Tableau
Foundation

