Here, Stephan Christner explains how to prepare an image with transparent fill, set up the underlying data (like Freshwater usage from Our World in Data), and turn on animation – no advanced tricks, just clever use of Tableau’s core features. If you’ve ever wanted to go beyond standard charts and inject some visual flair that still delivers analytic insight, this post will inspire and empower you. Give it a read, you’ll come away with a fresh, engaging technique to wow your audience.
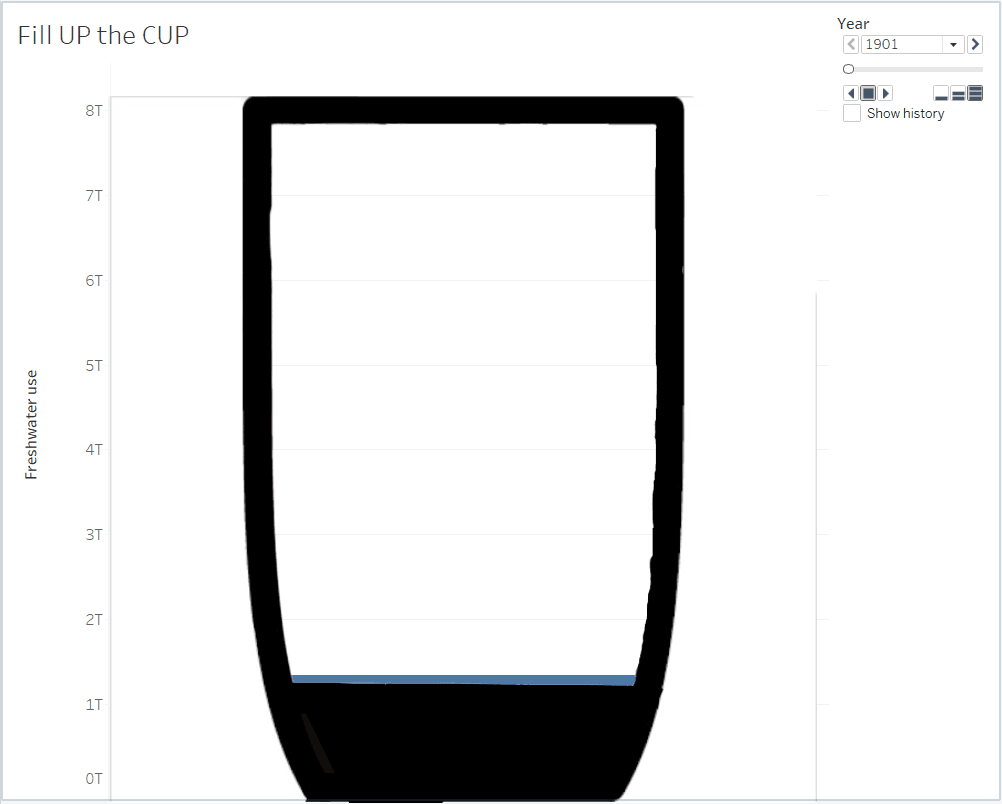

Tableau Training on
Tap Fast Track

Tableau Advanced Analyst

Tableau
Foundation

