Joseph Darton’s piece doesn’t just explain Z‑scores; it shows you how to use them with real data visualisations in tools like Tableau. You’ll see radar charts, boxplots, and step‑by‑step instructions for building them so you can put these ideas into practice. For someone who values deeper insight, this article gives both clarity and applicability.
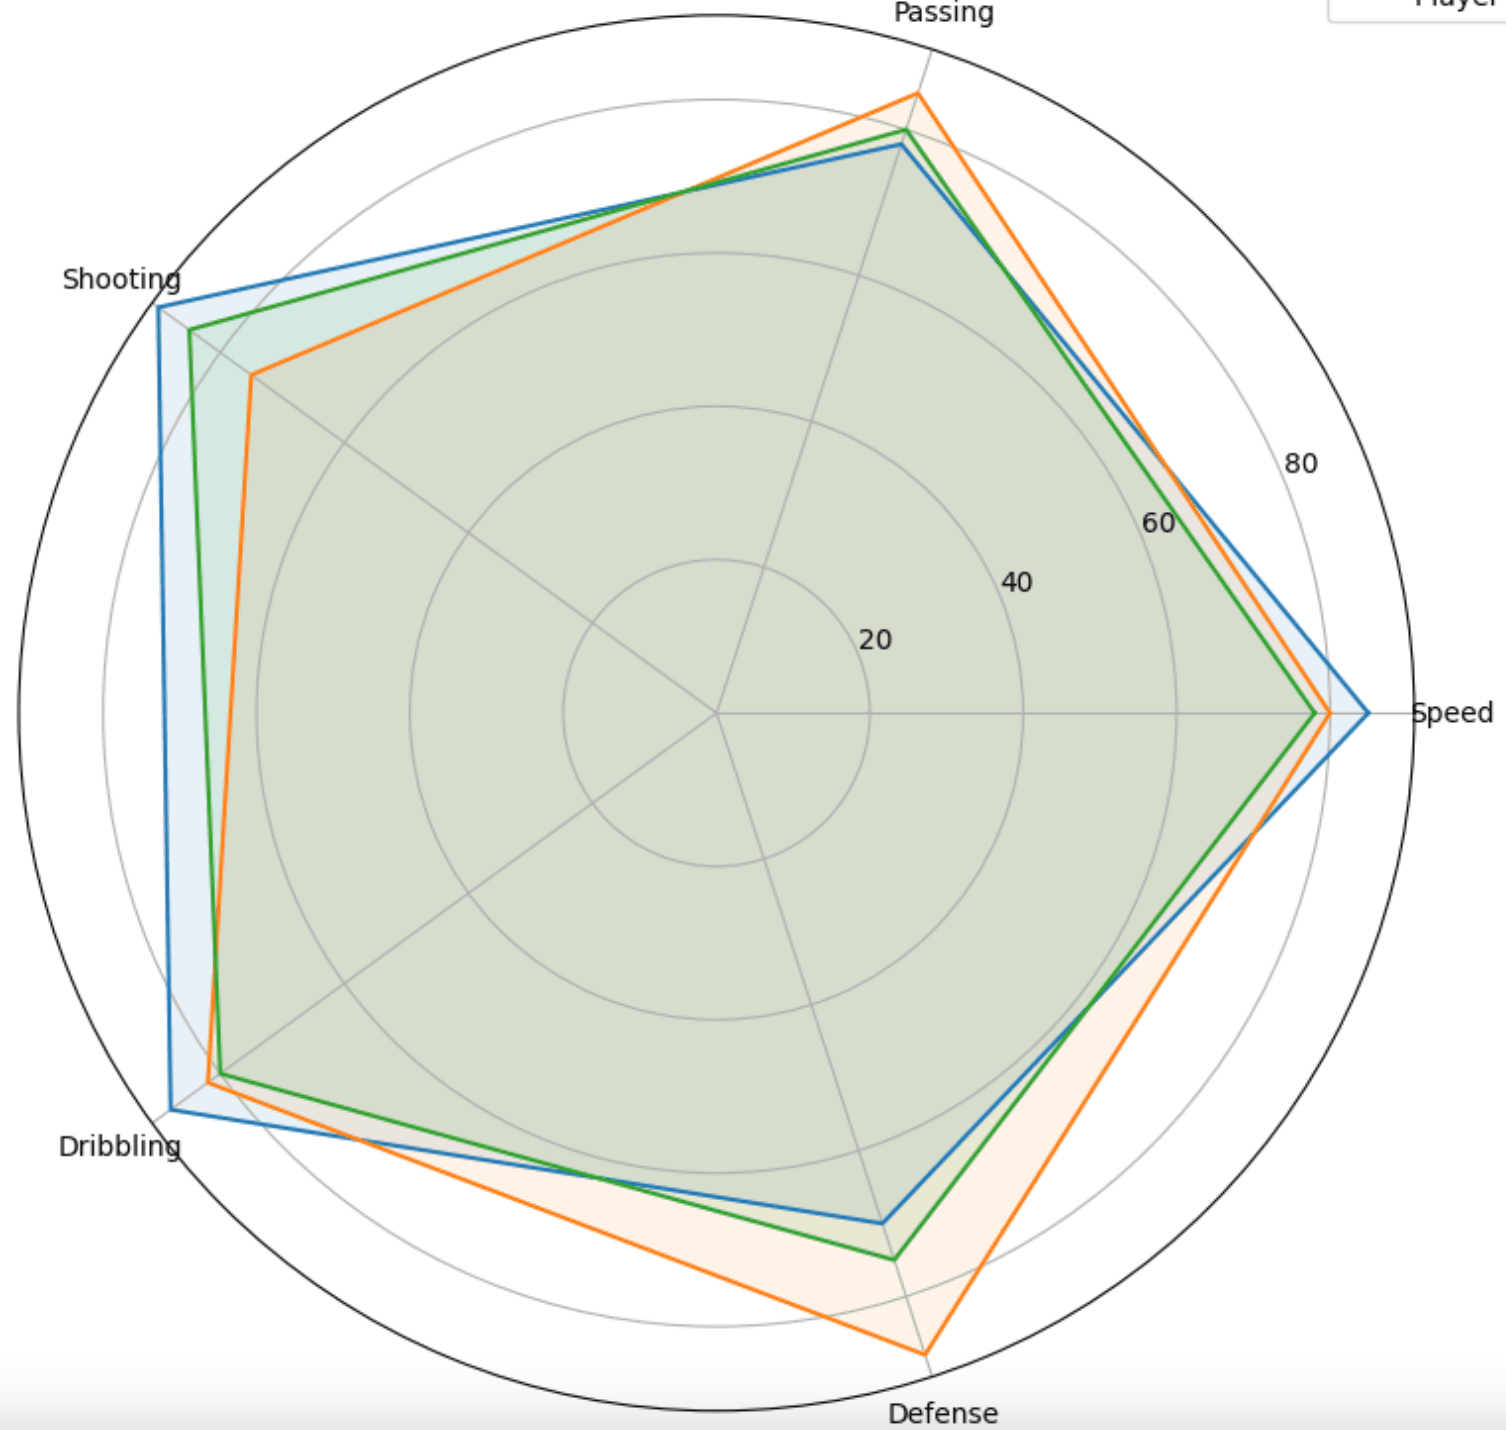

Tableau Training on
Tap Fast Track

Tableau Advanced Analyst

Tableau
Foundation

