Tristan Guillevin and Jessica Bautista have made it easy to adopt these advanced visualisations: no complicated coding or convoluted workarounds needed. With just drag-and-drop in Tableau, you can build a polished, dynamic line chart that behaves like a native sheet. Ever felt limited by Tableau’s out-of-the-box chart types? Here’s is an encouraging reminder that there are ways to stretch your visualisation toolkit, and that making data beautiful and expressive can be straightforward and efficient.
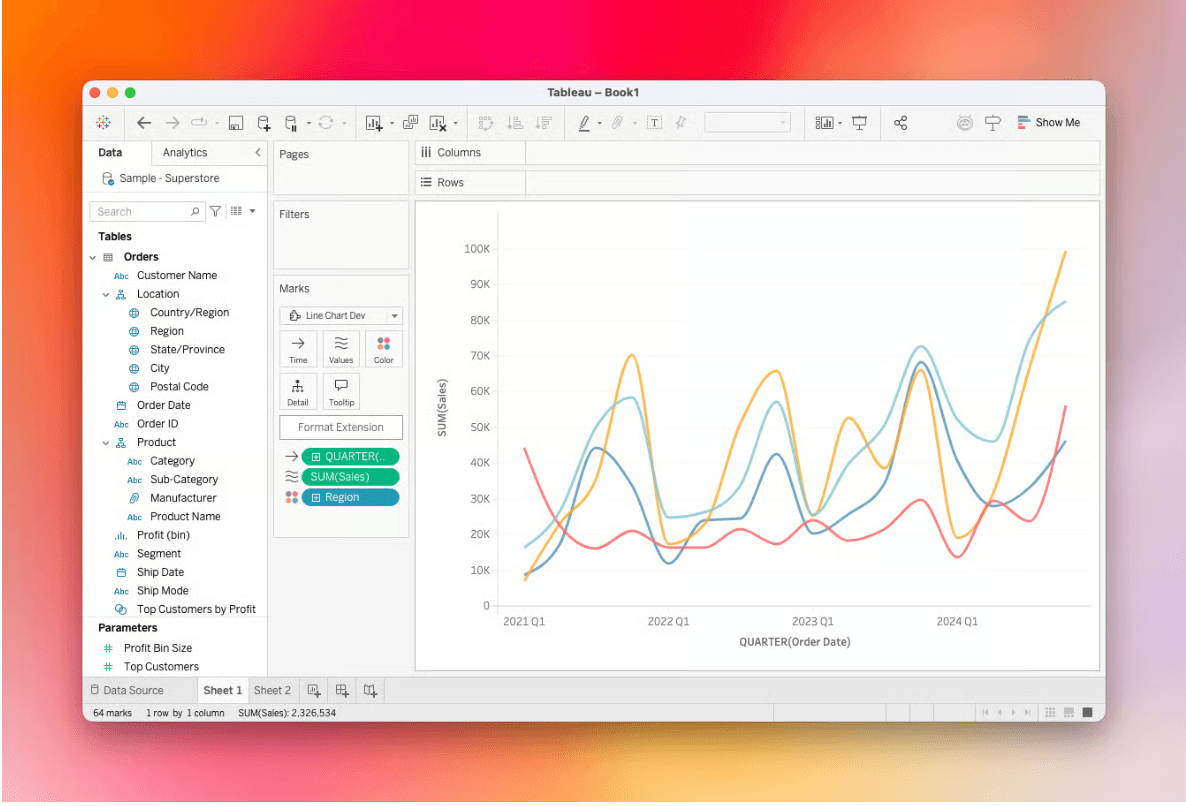

Tableau Training on
Tap Fast Track

Tableau Advanced Analyst

Tableau
Foundation

