Perfection Feels Productive. It Isn’t.
We beat ourselves up more than our stakeholders ever do.
A dashboard isn’t “quite right.”
A course could be “slightly tighter.”
The number isn’t 100%.
For the past five years, I’ve delivered structured Tableau training for an enterprise client, and we are still going strong.
Multiple cohorts.
New joiners.
Administrators.
People who don’t use data on a daily basis.
Experienced analysts that do.
Internal developers.
Every delegate must complete the evaluation before being issued their Tableau licence.
Over five years, one metric stood out:
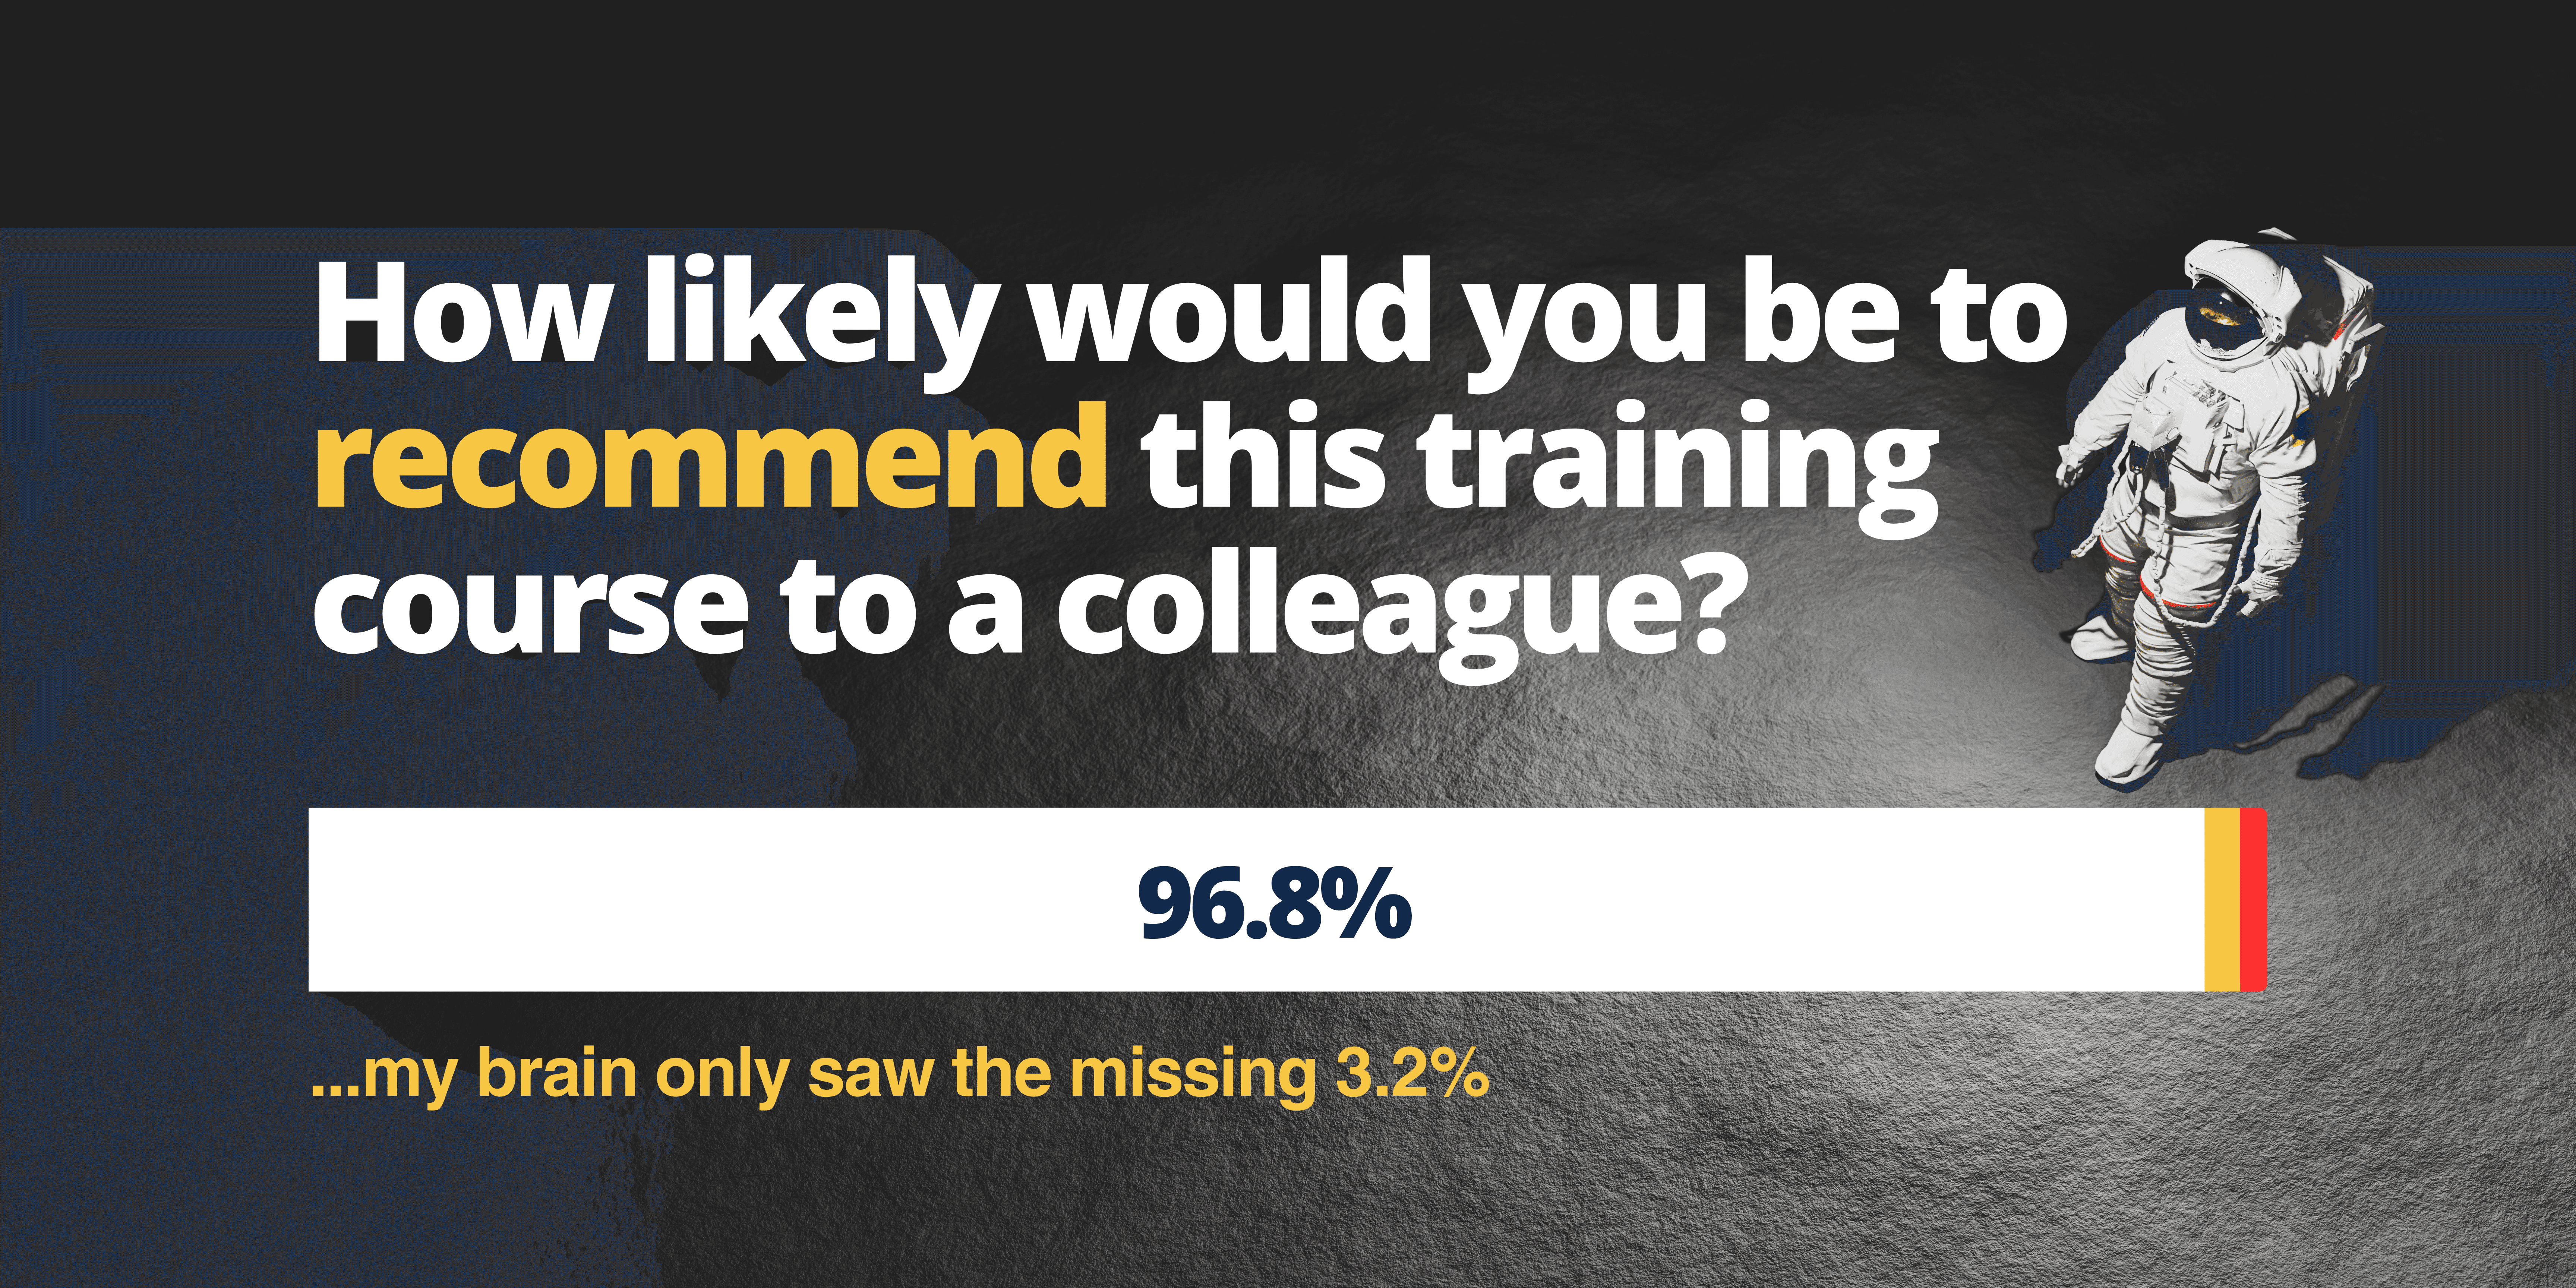
96.8% would highly recommend the training.
That’s consistency.
That’s repeat delivery.
That’s scale.
And yet…
My brain went straight to the 3.2%.
Why High Performers Still Chase 100%
If you build dashboards.
If you train others.
If you’re responsible for delivery.
You’ll recognise this.
The instinct isn’t celebration.
It’s optimisation.
“Where can we tighten?”
“What did we miss?”
“What could be smoother?”
That instinct is powerful.
But only if it’s directed properly.
Because perfection can quietly become a brake.
The Real Competitive Advantage
Most dashboard teams try to:
- Get it right first time
- Avoid criticism
- Impress stakeholders
- Reduce visible flaws
What high-performing teams actually do is different.
They:
- Ship a controlled Minimum Viable Product
- Invite structured peer review
- Analyse feedback trends
- Adjust grouping and preparation
- Improve iteration by iteration
Over five years, the biggest gains didn’t come from adding more content.
They came from:
- Pre-screening experience levels
- Aligning cohorts more precisely
- Preparing delegates before they arrived
- Being willing to say “this programme isn’t right for you yet”
That’s not perfection.
That’s process maturity.
And that’s very hard for competitors to replicate quickly.
The Dashboard Parallel
Dashboards behave the same way.
You cannot:
- Predict every filter interaction
- Anticipate every business question
- Simulate every real-world usage pattern
You can:
- Define scope
- Build clearly
- Apply best practice
- Peer review
- Publish an MVP
- Watch behaviour
- Close the gap
That’s the Quality Confidence loop inside the Powerful Dashboards framework.
Confidence doesn’t come from polish.
It comes from performance under real conditions.
The Gap Is the Gold
Between 96.8% and 100% isn’t failure.
It’s signal.
Between version one and version two isn’t embarrassment.
It’s refinement.
The organisations that win long-term aren’t the ones chasing applause.
They’re the ones engineering feedback into delivery.
Over time, that compounds.
If You’re Responsible for Tableau Enablement…
Ask yourself:
- Do we have a repeatable feedback loop?
- Are we grouping learners intelligently?
- Are we releasing dashboards early enough?
- Are we tracking performance trends over time?
- Or are we chasing “perfect”?
If you want to embed this properly inside your organisation – not just teach features but build a feedback-driven delivery culture – let’s talk.
👉 Book a call to discuss your enterprise Tableau training strategy
Perfection is a vision.
Feedback is the edge.


