Learn how to build the dual-axis structure needed for donut charts, align them seamlessly within a table layout, and apply thoughtful formatting to achieve a polished, professional look. Whether you’re working on business reporting or a personal project, this “chart-in-table” technique is a powerful way to elevate your data storytelling and create dashboards that truly stand out. Check out Waqar Ahmed Shaikh’s YouTube post today!
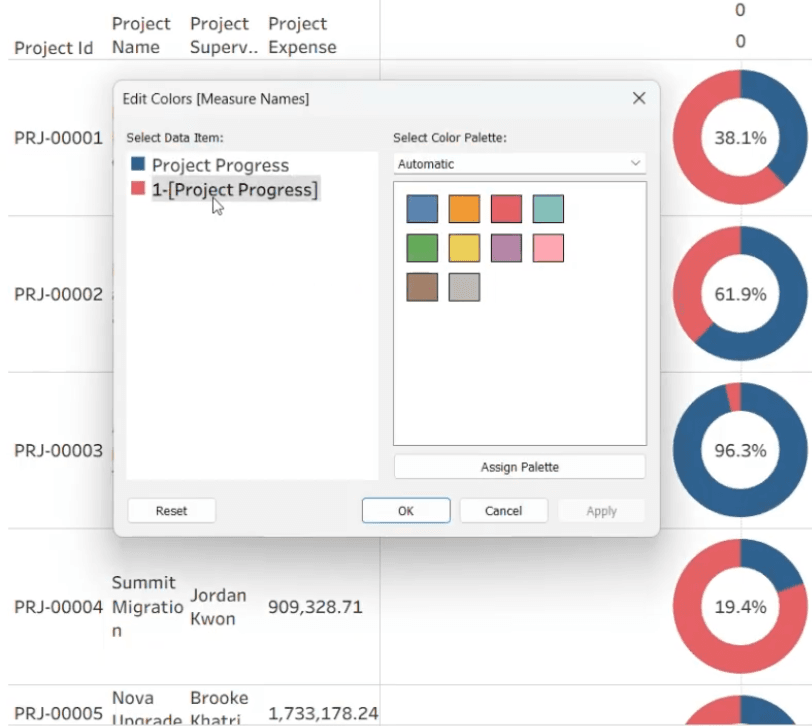

Tableau Training on
Tap Fast Track

Tableau Advanced Analyst

Tableau
Foundation

