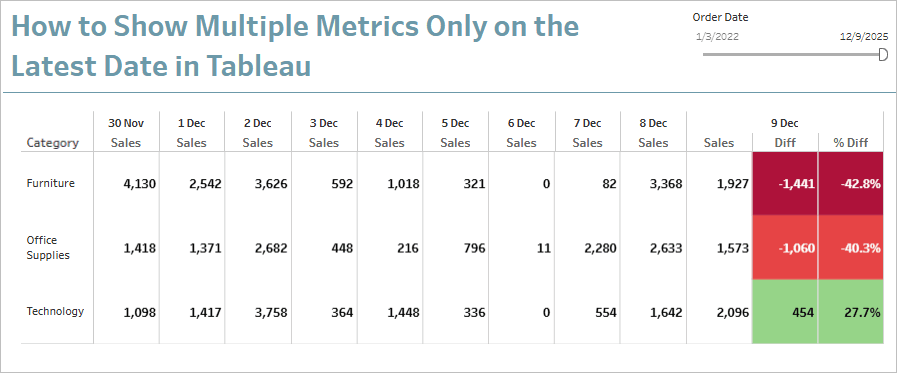
If you’ve ever built a time-series table in Tableau and wondered how to add contextual metrics — such as a difference from the previous day or a percentage change — without overwhelming your audience, Rosario Gauna’s latest blog has the answer. She introduces the explicit scaffolding technique, a smart approach that combines scaffolding, table calculations, and the LOOKUP() function to give you precise control over which metrics appear in which columns. Rather than displaying additional context across every date, this method surfaces it only on the most recent one, keeping your visualisation clean and your audience focused on what matters. Rosario breaks the whole process down step by step, from building the scaffold table to configuring the calculated fields and colour logic in Tableau. Whether you’re a seasoned Tableau user or still building your skills, this is a practical technique well worth adding to your toolkit.
How to Show Multiple Metrics Only on the Most Recent Date
Want to Get Latest Updates and Tips on Tableau Bites Blogs
Sign Up For Newsletter


