Funnel charts are a powerful tool for depicting step-by-step drop-off within a process. Whether you’re analysing sales conversions, onboarding flows, or customer journeys, a funnel view helps make complex behaviour clear and easy to follow. As each stage narrows, it highlights points of friction or opportunity, offering valuable insight into where you can make improvements. The layered area approach not only looks polished but also improves readability by emphasising differences between stages. Johan de Groot helps you ensure your funnel remains intuitive and precise.
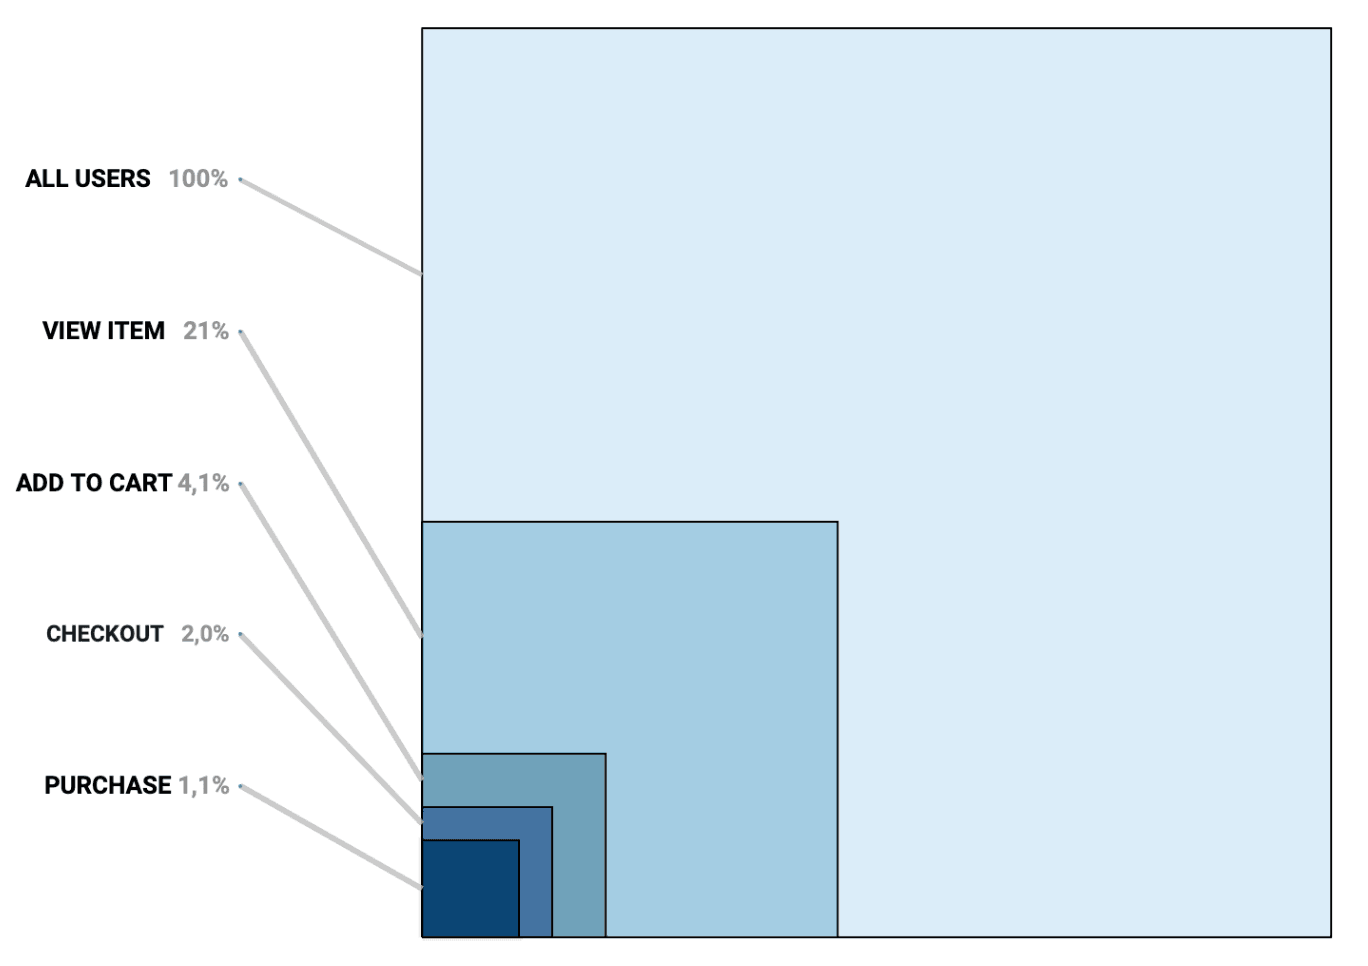

Tableau Training on
Tap Fast Track

Tableau Advanced Analyst

Tableau
Foundation

