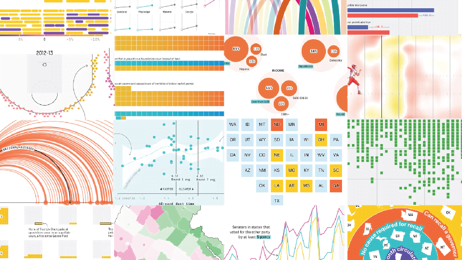
The list of 2021 visualization lists
A great post by Maarten Lambrechts. “Following a yearly habit: this is the seventh edition of the list of visualizations, charts, graphics, maps, data and satellite journalism and science photography…
A great post by Maarten Lambrechts. “Following a yearly habit: this is the seventh edition of the list of visualizations, charts, graphics, maps, data and satellite journalism and science photography…
“Based on a very simple data set, it’s amazing the variety of solutions the community can come up with!” This initiative is hosted by The Tableau Student Guide (Founded by

“Want to total across the row or column, rank a dimension, or pick out a single value? Then you need a Table Calculation! But how?” Jim Dehner tells us how…
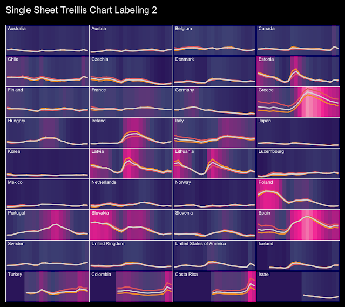
Alexander Mou talks through it with us “To many people, the most difficult part of creating a trellis chart is to label it…” Read Original Article…
Toan Hoang shows us here is a Tableau Quick Tip (QT) on creating a Bar Chart with a floating icons. Read Original Article…

A post highlighting seven best practices you can apply right now to make your dashboards more effective. By Andy Cotgreave. Read Original Article…
Kevin Flerlage shares a few examples with us… Read Original Article…
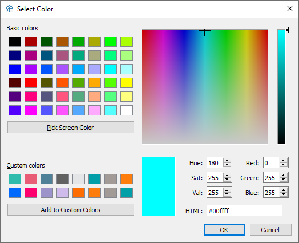
Introducing the Transparent Colour Hex Code in Tableau Read More »
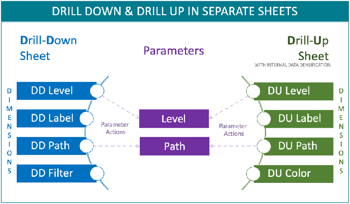
Rosario Gauna: “I have always been fascinated by the different techniques that Tableau can use to perform Drill Down & Drill Up exercises.” Read Original Article…
Technique: Drill Down & Drill Up in Separate Sheets Read More »
In this tip, Andy Kriebel shows how to create a calendar to use as a filter on a dashboard… Read Original Article…
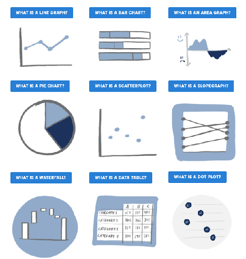
Brandi Beals shares some examples on how to – the main components of this easy-style guide being fonts, colours, and design elements. Read Original Article…
