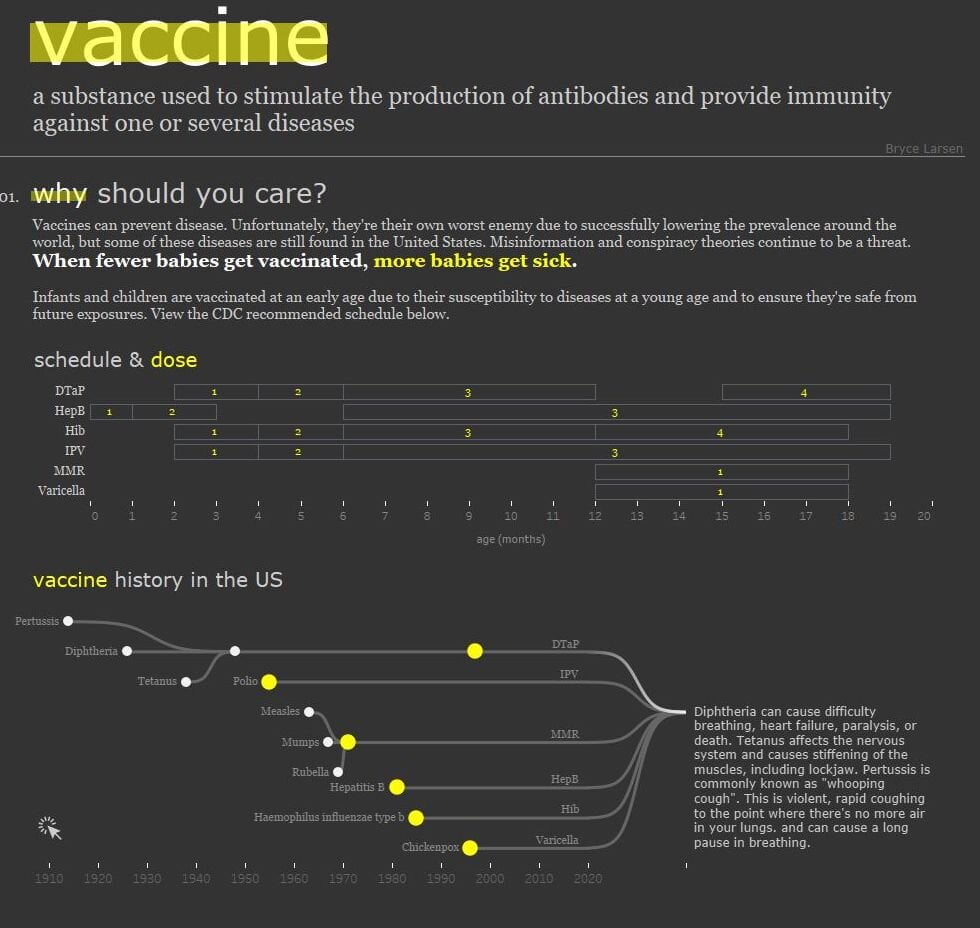
Sep 21 Iron Viz – Vaccine
Bryce Larsen shares his entry for Iron Viz, health and wellness being this year’s theme… Read Original Article…
Bryce Larsen shares his entry for Iron Viz, health and wellness being this year’s theme… Read Original Article…

“The following is a guest blog post from Julie Laux. Julie is a marketing professional, graphic designer, and web developer who decided to take a leap of faith in 2016
Guest Blog Post: Rapid Dashboarding – 5 Steps to Success Read More »
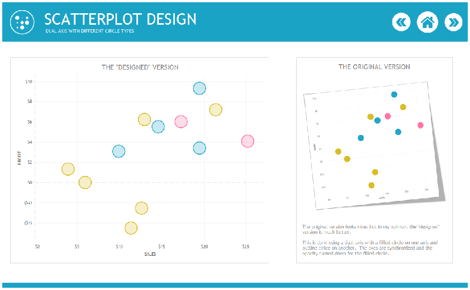
“In this blog post, I intend to do what I had originally planned and focus solely on different ways to design charts and dashboards purely for aesthetic (although there are
Priyanka Dobhal poses the question: “Have you used a min(0) or min(1), avg(0) etc. ? Or have you seen someone use it?” Here, she shows us a few examples… Read
Tableau: Min(0), Avg(0)? Where would I use this? Read More »
Sadiya Girach talks through how her team collaborates on dashboard development with duplicate data sources. Read Original Article…
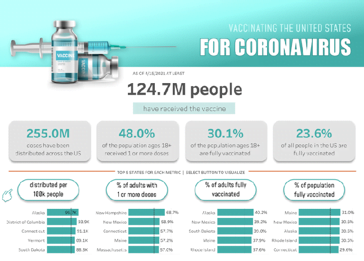
“With various COVID vaccines now becoming available around the world, many organizations and individuals have created data trackers, visualizations and dashboards…” See Lindsay Betzendahl’s dashboard that she designed and built.
“With Tableau’s mapping features you too can explore geographical data and begin to answer those ‘where’ questions.” A great post by Marc Reid. Read Original Article…
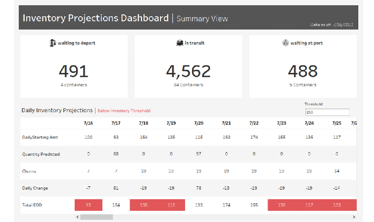
Forecasting Inventory in Tableau Using Relationships Read More »
“My career went from Tableau being a supplemental part of my reporting responsibilities to my full-time role…” Autumn Battani shares her top ten Tableau tips. Read Original Article…
In this post, Ken Flerlage shares 3 methods showing us how to do this… Read Original Article…
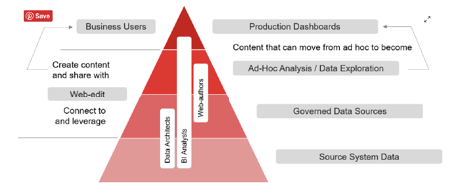
Simon Beaumont: “I am going to share my perspective of a Tableau web-edit playbook, an end to end strategy from vision and implementation through to an ongoing community and fostering
