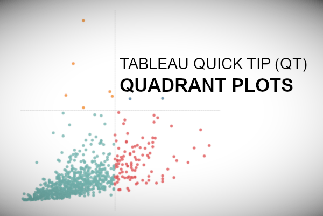
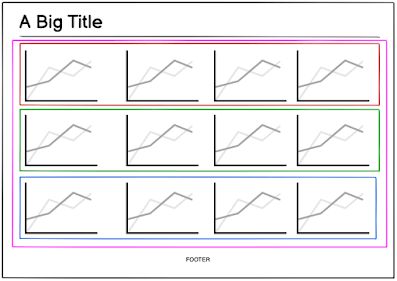
Tableau QT: Quadrant Plots
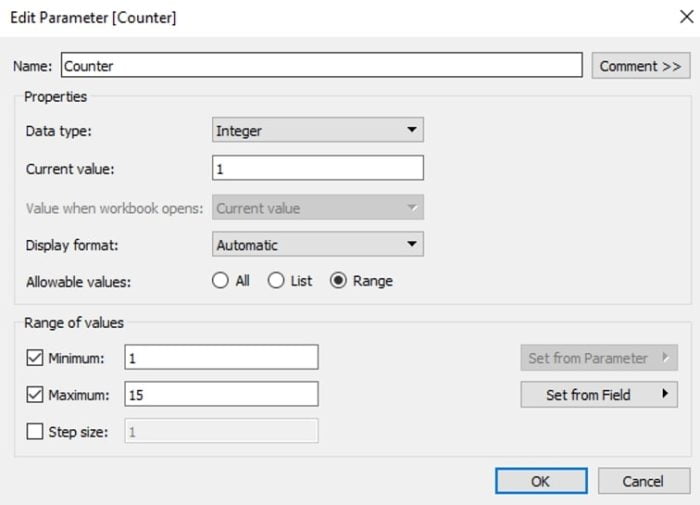
Toan Hoang tells us “I love Quadrants Plots as a quick way to segmenting your data, so please enjoy this Tableau Quick Tip (QT) which you can do in 5…
Toan Hoang tells us “I love Quadrants Plots as a quick way to segmenting your data, so please enjoy this Tableau Quick Tip (QT) which you can do in 5…
“If there’s one thing I’ve learned about Tableau in the four years I’ve been using it, it’s that you can make it do pretty much anything. Even those things that
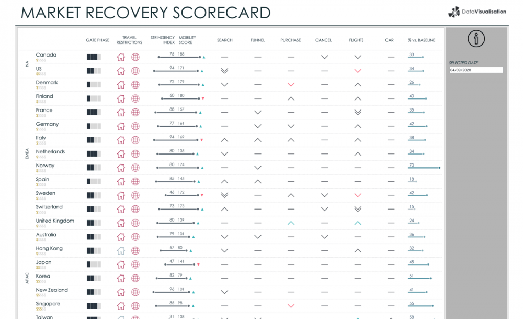
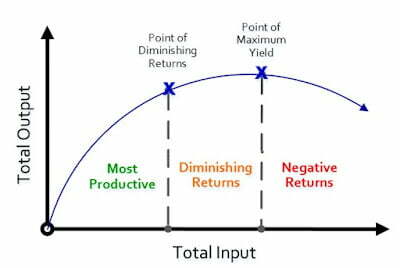
We needed to rapidly understand how the business was being impacted so that we could make the necessary adjustments until the industry began to show signs of recovery, at which
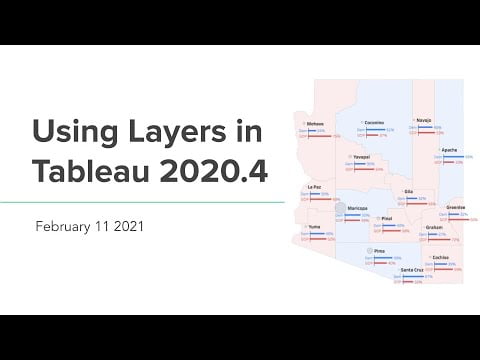
By Adam McCann, Zen master. “Tableau 2020.4 allows you to add more than two mark layers in a single worksheet. This allows you to create maps in Tableau with multiple
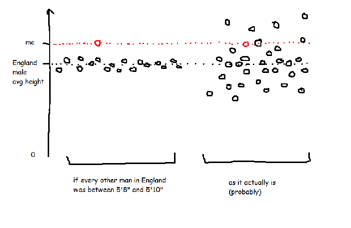
What are Z scores? How can you calculate them in Tableau? And once you’ve done that, what can you use them for? This blog, by Gwilym Lockwood, will cover all
Here, Lindsay Betzendahl talks about a really fantastic viz by JR Copreros (on NBA shooting accuracy) and how its the little details that made his viz quite memorable… Read Original
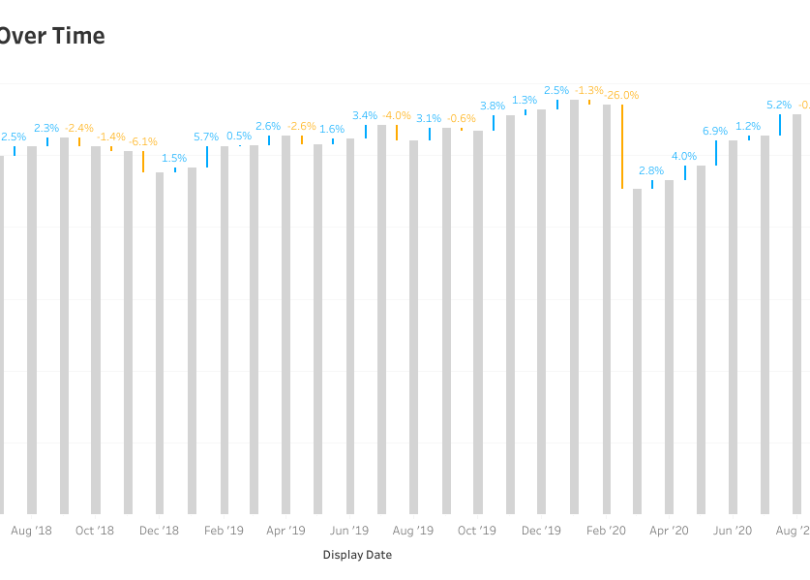
How To Create a Time Bar Chart with Variance Indicators in Tableau Read More »
Layout containers are super useful, if you understand the concept for how to use them, explains Andy Kriebel. In this livestream, he builds a simple KPI dashboard of social media
In this post, Brandi Beals dives into how we determine what content to focus on at meetings (her previous post being how she organises meetings for the Milwaukee Tableau User
In Ken Flerlage’s opinion, every Tableau user should know the basics of how (and when) to use Tableau Level-of-Detail (LOD) calculations. In this blog, he shares 20 different use cases
Keith Dykstra and his colleague Kendra Allenspach had put together a visual story about InterWorks’ musical preferences using Spotify Wrapped data. Through some trial and error, they discovered a unique
Using Parameter Actions for Interactive Data Storytelling in Tableau Read More »
