
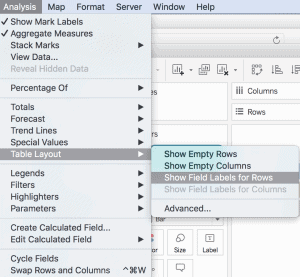
HOW TO MAKE DYNAMIC TOOLTIPS
In this post, Ryan Sleeper shares how to make dynamic tooltips, allowing you to show different information for each mark. Read Original Article…
In this post, Ryan Sleeper shares how to make dynamic tooltips, allowing you to show different information for each mark. Read Original Article…
It’s always difficult picking up someone else’s work to continue, and this article by Bridget Cogley gives some Tableau specific tips. Read Original Article…

Andy Cotgreave tells us there is simply no way you can open a dataset and know, ahead of that exploration, how best to display it. Read Original Article…

The Tableau Research and Design team presents their initial findings from an eye-tracking study. Read Original Article…
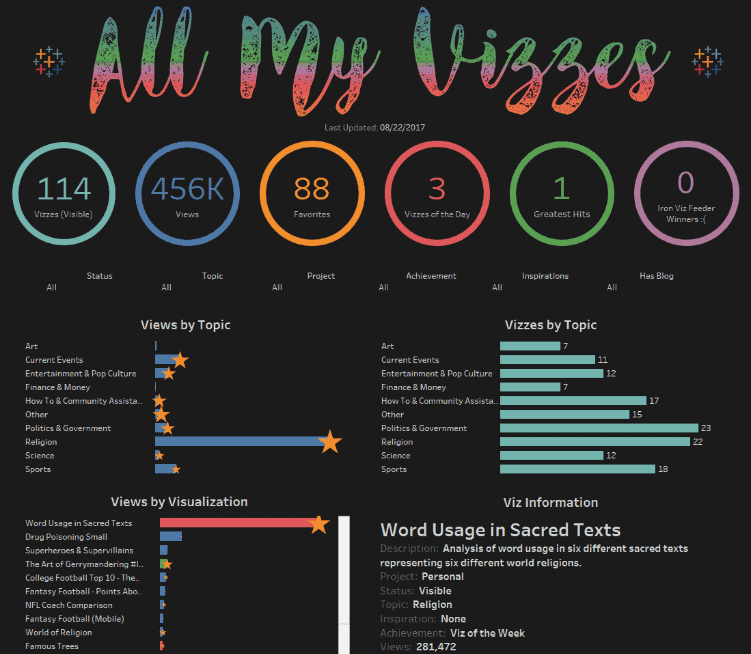
Ken Flerlage has been posting Tableau Public dashboards for a while now and thought he’d summarise some off them. Some interesting samples of work – don’t forget to browse the
Just in case you missed it, the latest version was released this month. Take a look at some of the new features. Read Original Article…
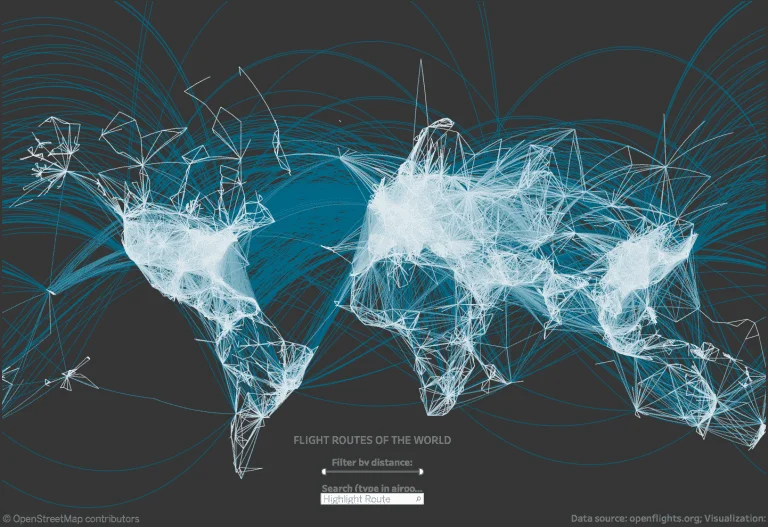
The spatial file connector now also supports linear geographies allowing infrastructure networks to be easily plotted. Read Original Article…

Ryan Sleeper shows how to dynamically group everything outside the Top N into “Others” to maintain 100% of the data in a visualisation. Read Original Article…
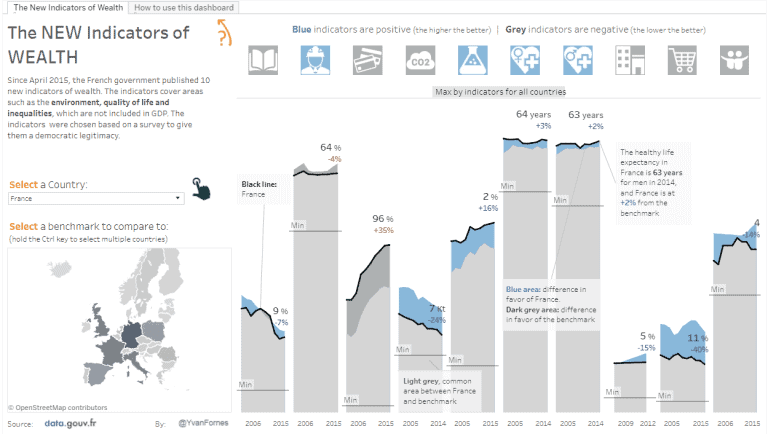
Yvan Fornes tells how to perform benchmark analysis against the total population, or a subset of the data. Read Original Article…
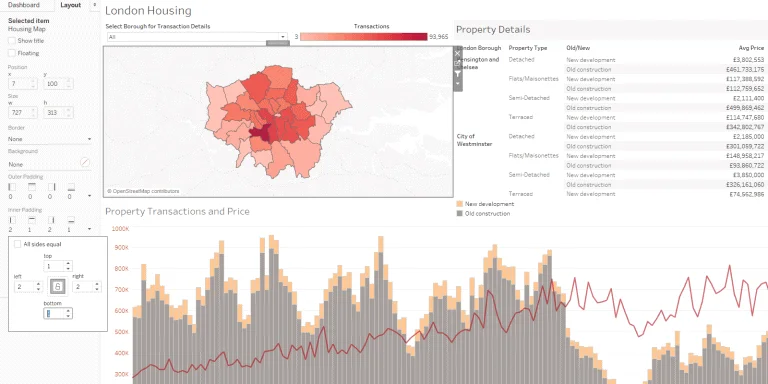
Elena Hristozova tells us she used to hate Tableau’s dashboard containers. These tips are intended to help you learn to love them. Read Original Article…
