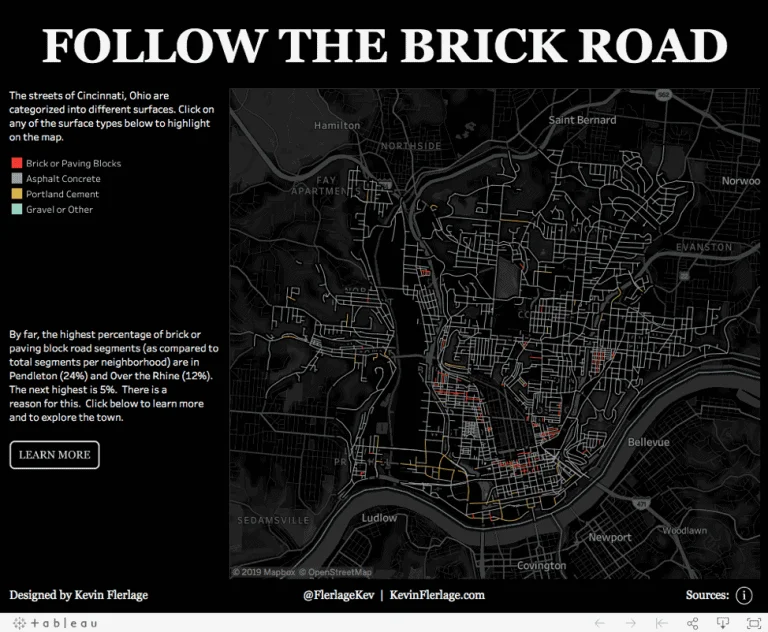
OVERCOMING THE VECTOR MAP LEARNING CURVE
Kevin Flerlage showcases one of the newest features from the release of Tableau Desktop 2019.2, vector tile mapping. We all love a good map right? Kevin overcomes the vector map…
Kevin Flerlage showcases one of the newest features from the release of Tableau Desktop 2019.2, vector tile mapping. We all love a good map right? Kevin overcomes the vector map…
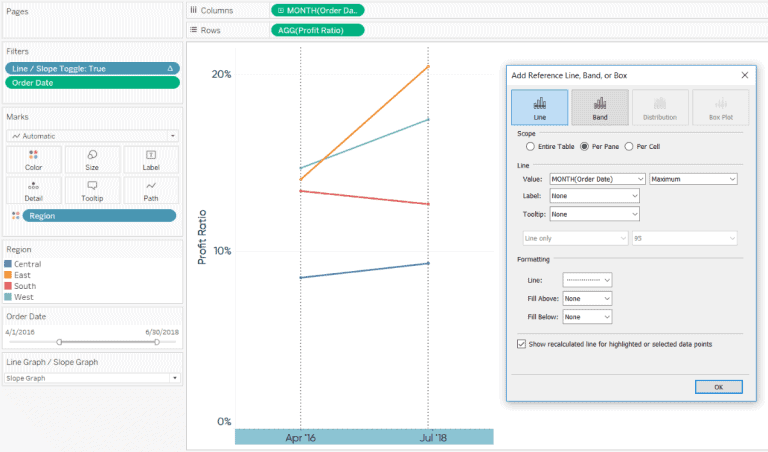
Tableau Zen Master Ryan Sleeper outlines three different ways of making your slope graphs splendid. It includes making the graphs dynamic-based on a date range filter, adding a slope graph
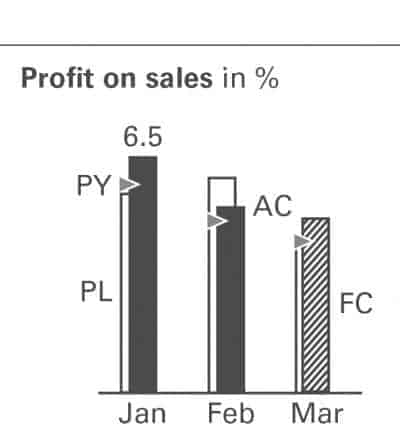
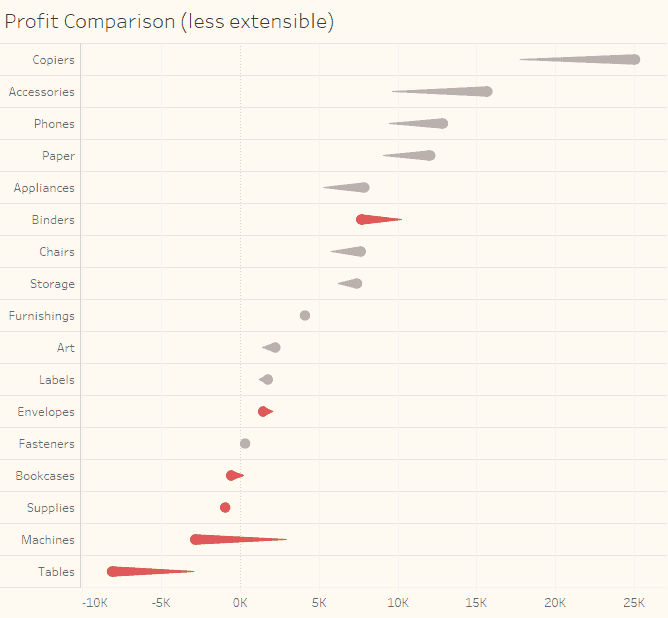
Four Tableau Zen Masters in one newsletter? The fourth Zen Master to be featured is Unifund’s Jeffrey Shaffer who has written an excellent post on how to build overlapping bar
HOW TO BUILD AN OVERLAPPING BAR CHART IN TABLEAU Read More »
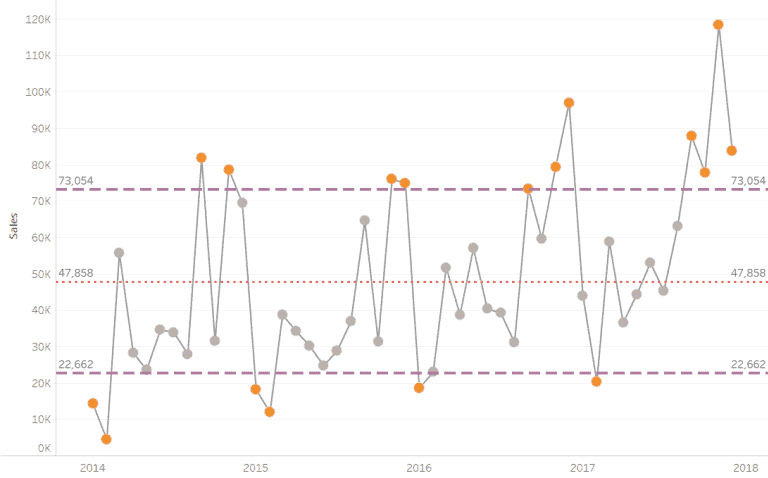
If you already know about creating a control chart, then Promatix’s Chris Dickinson has a blog post that will pimp your control charts in Tableau, taking these charts to the
Tableau 2019.2 was released very recently. This article will allow you to explore the extensive new features including parameter actions, vector maps, show/hide dashboard containers, customisable reference line tooltips, and
Joe Oringel, the Managing Director of Visual Risk IQ elaborates on how they have helped finance and internal audit professionals utilise Tableau effectively in this recent article. Read Original Article…
HOW VISUAL ANALYTICS HELPS AUDIT AND RISK PROFESSIONALS SHORTEN TIME TO INSIGHT Read More »
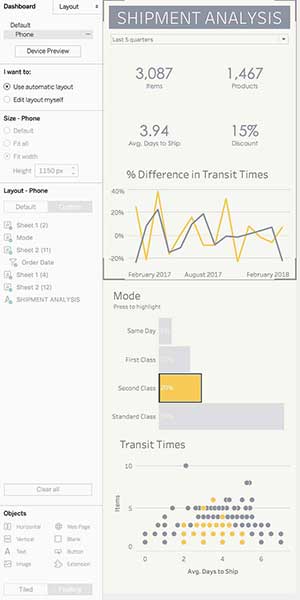
Recently, Tableau introduced a faster way to mobilize your dashboards to users on their phone with the automatic mobile layouts feature. Bridget Winds Cogley talks through how to make the
TIPS FOR CREATING MOBILE DASHBOARDS WITH NEW AUTOMATIC LAYOUTS FOR TABLEAU Read More »
Sara Hamdoun from the Data School, shows us this simple yet neat tip for indicating whether a number is positive or negative. In this example, she uses the Sample –
QUICK TABLEAU TIP – HOW DO YOU ADD ‘+/-‘ OR ‘▲/▼’ TO LABELS? Read More »
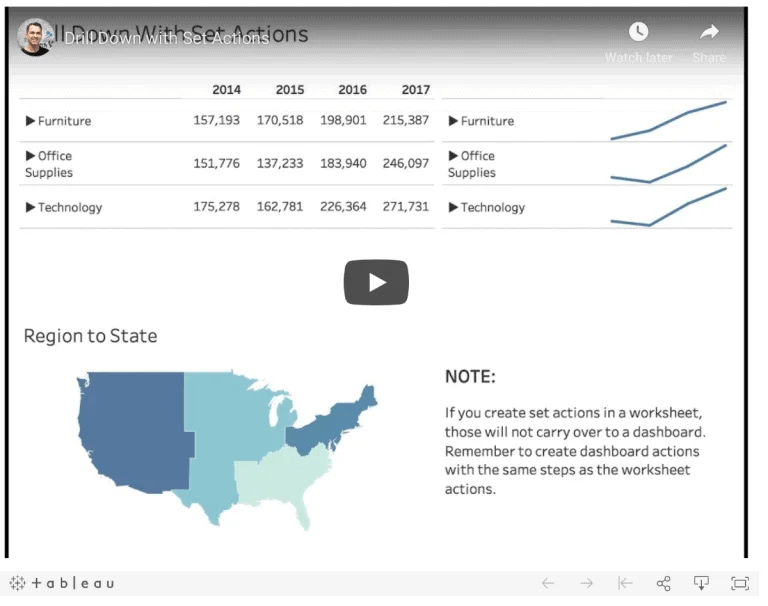
Andy Kriebel, from The Information Lab, shows us a handy tip to take you through how to set up basic drill-down view using the new set actions feature in this
HOW TO SETUP A BASIC DRILL DOWN WITH SET ACTIONS Read More »
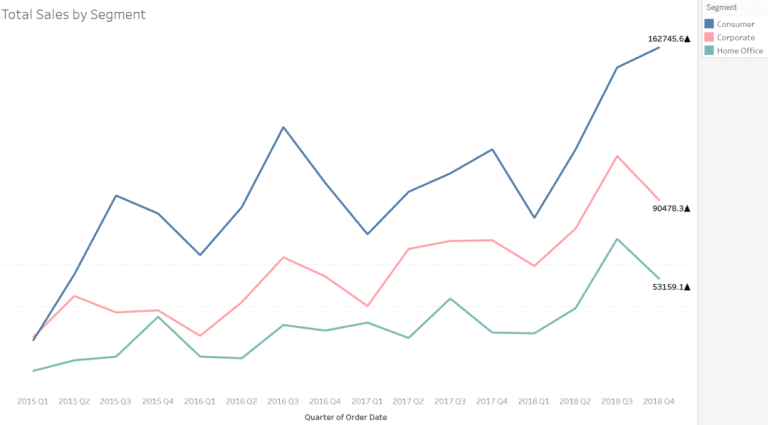
This ‘How to’ from Steve Wexler (co-author of The Big Book of Dashboards), explores how a measure for one period can be compared with a previous period – a common
