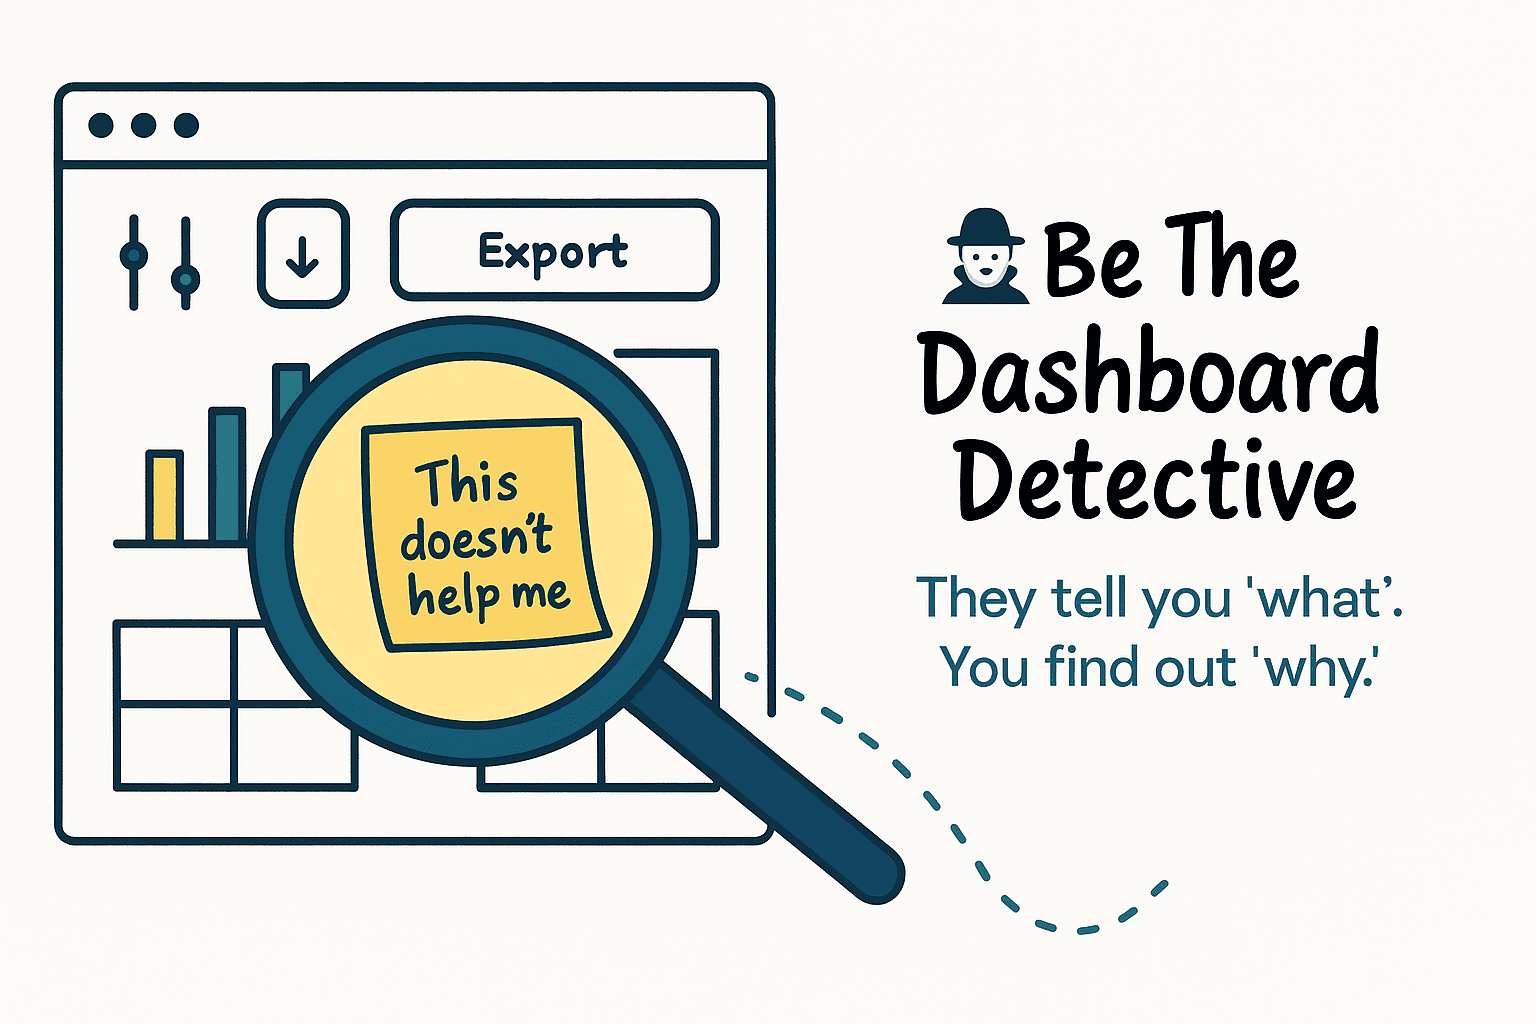
They tell you ‘what’. It’s your job to find out ‘why’.
The Brief Isn’t the whole Truth and Nothing But the Truth…
When a stakeholder says, “Can I have a bar chart?” they’re not giving you a requirement. They’re giving you a starting point. Because most dashboard requests aren’t rooted in clarity. They’re rooted in what feels familiar, safe, or easy to justify.
The truth? Stakeholders don’t just struggle to articulate what they need. They’re often not sure what they need in the first place.
Why Stakeholders Struggle
You’ve seen it before:
➜ They ask for “a copy of the old report” ➜ They request a download button and don’t explain why ➜ They ask for filters ‘just in case’
It’s not laziness. It’s not even resistance. It’s a mix of data literacy gaps, visual fluency limits, and a natural instinct to avoid feeling exposed.
In fact, the more senior the stakeholder, the more this kicks in:
- They may avoid asking “obvious” questions to avoid looking naïve
- Or assume you already understand their world
- Or delegate too early, thinking it’s now your job to work out what’s needed
And when they describe their current process? They often ‘clean it up’ in the retelling. Give you the ideal vision of the current process, rather than the dirty reality. That means your dashboard risks being built on sand, not rock.
What They Say vs What They Do
The most honest feedback isn’t verbal. It’s behavioural.
- If someone always exports the chart, something’s broken.
- If they skip your “insights” tab, it’s not useful.
- If they stitch reports together in Excel, you missed something upstream.
So when you’re gathering requirements, you’re not just capturing features – you’re decoding signals.
Be The Dashboard Detective
This isn’t about asking for more detail, it’s about going beyond the brief.
Here’s your real toolkit:
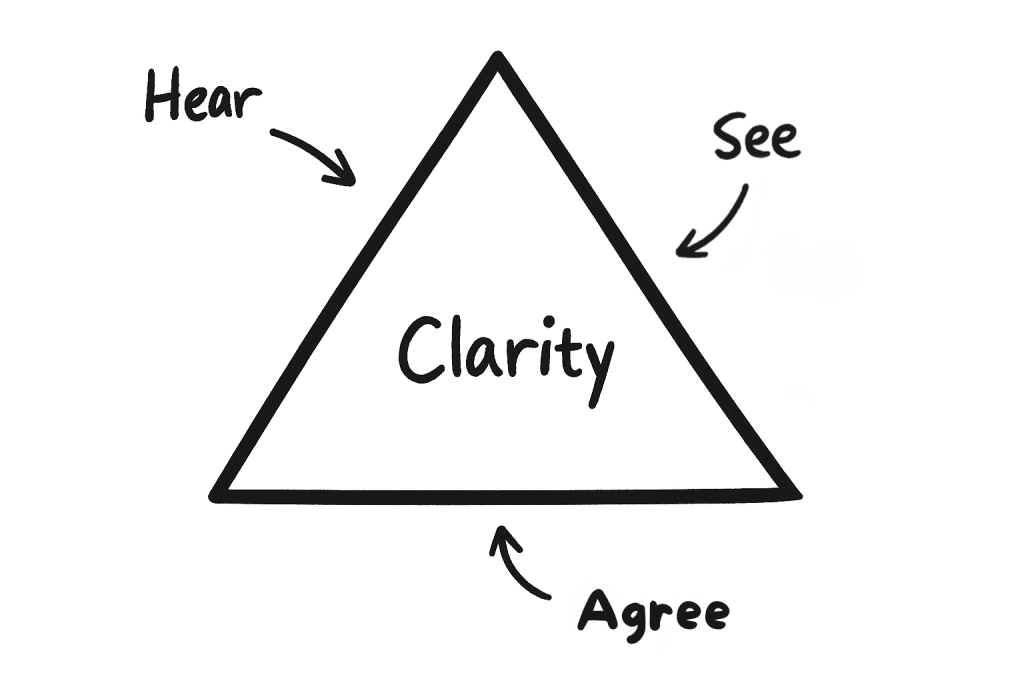
👂 Hear – the language they use to describe problems 👀 See – what they actually do with the data 🛠️ Agree – on what’s possible through design and iteration
This isn’t a list of steps. It’s how you tune in, watch closely, and build together. It’s how to become the friendly Dashboard Detective.
Clarity = Hear + See + Agree
When even one of those is missing, what you build will fall short. When all three show up? You go from building dashboards to driving decisions.
The Journey to Better Requests
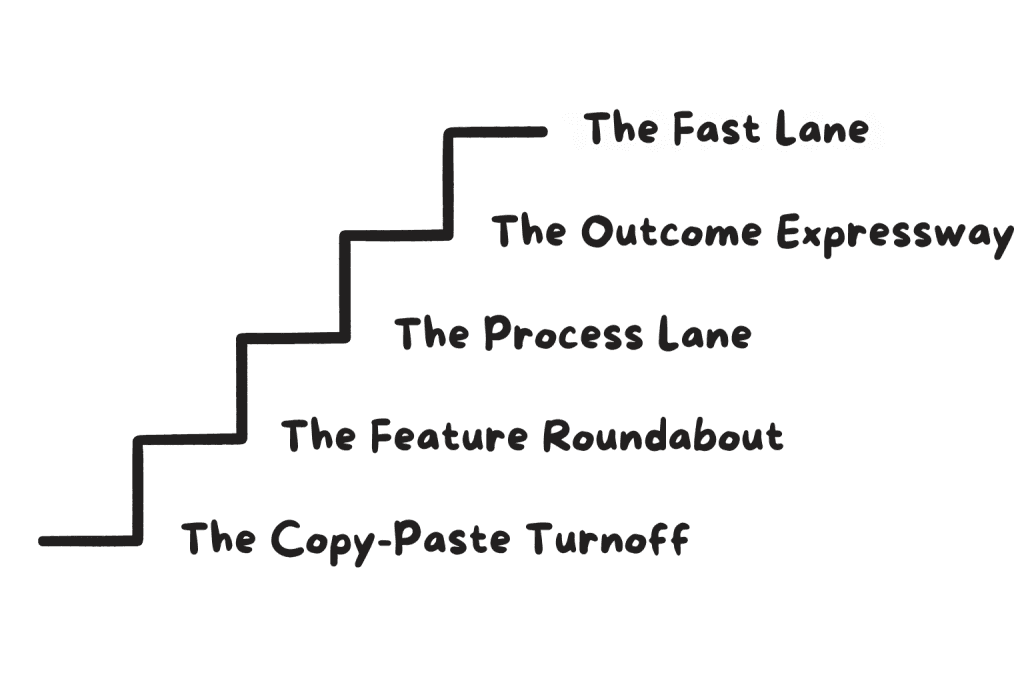
Every dashboard project starts somewhere. But not every project starts well. Here’s how most stakeholder input evolves over time – like a journey from guesswork to clarity:
- The Copy-Paste Turnoff – “Just give me what we had before.”
- The Feature Roundabout – “Add filters for this… and a pie chart here… and maybe a heatmap?”
- The Process Lane – “We need to track what’s slowing this down.”
- The Outcome Expressway – “We’re trying to reduce missed targets. Can you show me that?”
- The Fast Lane – “Here’s our objectives, the key results we’re prioritising and the challenges we are facing. How would you suggest this dashboard can help us?”
It’s your job to help them shift gears, from simply being a requestor of specific requirements, to becoming you becoming a partner in their success.
Where This can fit into your Powerful Dashboards™️ Framework
This principle isn’t an optional overlay, it’s embedded in how we build, teach, and co-create dashboards at every stage:
- During Scope Agreed, it helps uncover the real ‘why’ behind the ‘what’
- When we Select Templates, we use contrast to trigger honest feedback
- In Interactive Dashboards, we learn more from use than from specs
- And at the MVP stage, we treat the first release as a learning tool, not the final product
Put simply: If you’re not investigating behaviour, you’re not designing.
One Final Reminder
They tell you ‘what’. Its your obligation to find out ‘why’.
Stakeholders aren’t lying to you. But they’re often unsure, overstretched, or working within blind spots. That’s why your value isn’t in how fast you build. It’s in how well you observe, ask, and reveal.
Be the Dashboard Detective.
Want to practise this in your work?
Join our next Tableau Insights Community, starting from £50, where you’ll learn how to extract real needs, challenge bad briefs, and deliver dashboards that speak for themselves.
(And as part of membership you can jump onto our upcoming Beginner and Intermediate Bootcamps.)
Appendix: Supporting Research & References
- The Curse of Knowledge: Experts often assume shared understanding. First described by Elizabeth Newton (1990). HBR summary
- Visual Literacy in Business: Most professionals default to tables due to comfort, not clarity. (Few, S. “Show Me the Numbers”)
- Delegation and Design Trust: “Design brief quality is inversely correlated with stakeholder seniority.” (IDEO Field Notes, 2018)
- Observation Beats Survey: Behavioural data often contradicts self-reporting. (Kahneman, D. “Thinking Fast and Slow”; Nielsen Norman Group: “Why You Should Watch Users, Not Just Ask”)
This article was featured in Tableau’s Weekly Roundup.


