Every step is illustrated, and David Gandary addresses subtleties like how reference lines aggregate and why you need a “fixed LOD” to prevent multiplying values by mark count. If you build dashboards that must read intuitively at a glance (for executives, clients, or non‑technical users), this post gives you a blueprint for making filters more expressive, interactive, and effective.
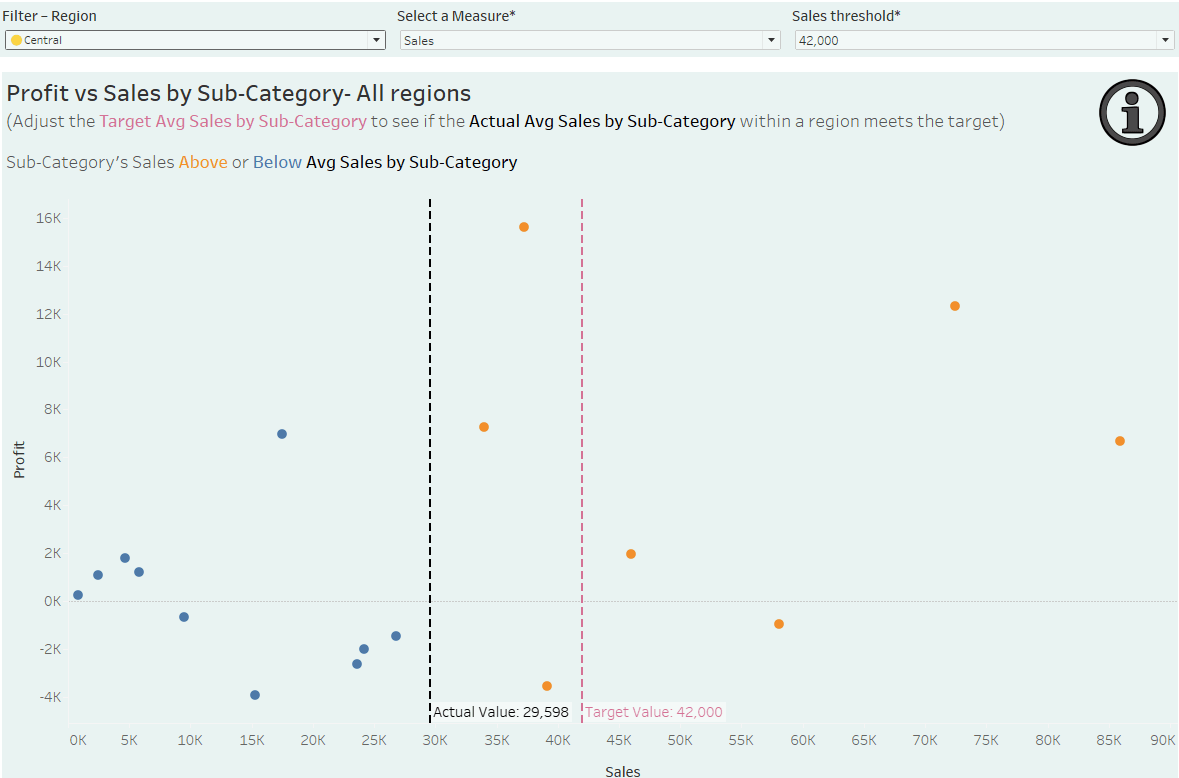

Tableau Training on
Tap Fast Track

Tableau Advanced Analyst

Tableau
Foundation

