Just what does Include and Exclude do?
A great new series by Brian and Jacqui Moore from Do Mo(o)re With Data, in which they’ll “look at one very custom chart, something with almost no real use cases,…
A great new series by Brian and Jacqui Moore from Do Mo(o)re With Data, in which they’ll “look at one very custom chart, something with almost no real use cases,…
Here, Kasia Gasiewska-Hoc goes through a tutorial with us… Read Original Article…
Guest blog post: Percentage trend calculations – an easier way! Read More »

An informative post by Kevin Flerlage. Read Original Article…
Five things you can do in web edit, but NOT Tableau desktop Read More »

Heidi Kalbe and Annabelle presented at the TC22 and in this post, Annabelle runs us through her favourite Tableau Speed Tips for Beginners. Read Original Article…
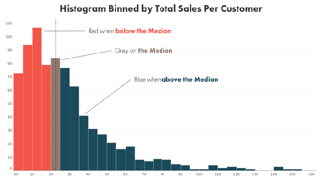
At TC22 Ken Flerlage did a section called “Cool Stuff with Histograms” and, while some of the tips used are on his earlier blog, much of them were not. So,
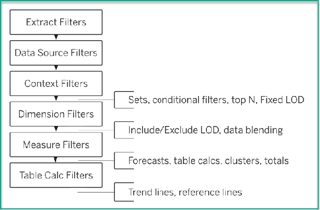
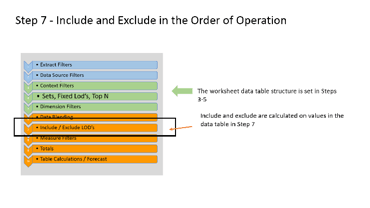
Do you have a dashboard that has filters on it, but they don’t seem to work?Tableau has an order that it applies certain actions. Dawn Harrington talks you through what
Tableau’s order of operations or everyone’s data can dance many times. Read More »
What are features our community wants to see in upcoming Tableau releases?Adam Mico has put in some real effort to collect ideas from users and the community and created this
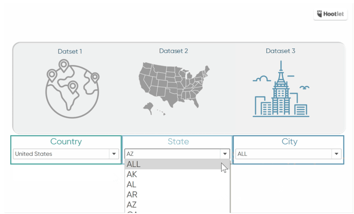
Maggy Muellner shows us how… Read Original Article…
How to dramatically switch data sources using Tableau parameters Read More »
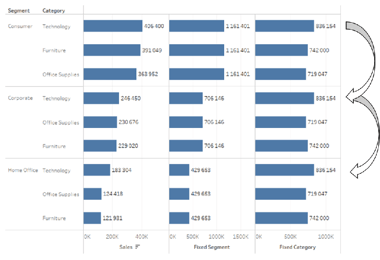
‘Simply put, LOD calculations allow us to create and display calculations at a different level of detail than the data displayed in our visualization.” Great post by Mateusz Karmalski. Read