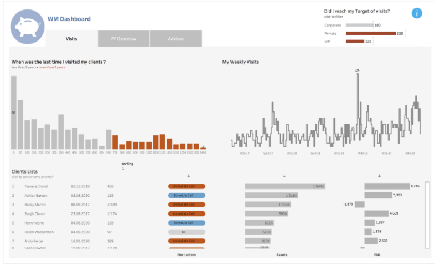
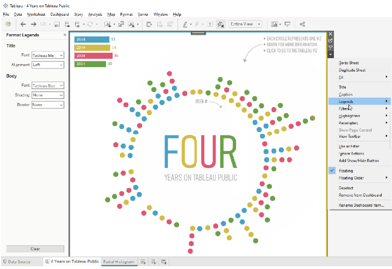
New uses cases for parameter actions
Here, Annabelle Rincon shares interesting use cases, combining different datasources Read Original Article…
Here, Annabelle Rincon shares interesting use cases, combining different datasources Read Original Article…
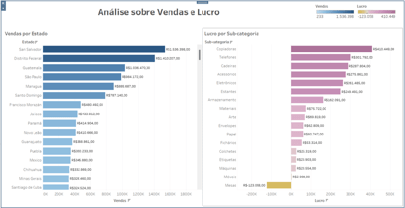
In this tip, PATH (the data people) will show us how to use calculated fields and filter action to update worksheet titles using the SuperStore public database, available in Tableau.
Using calculated fields and filter actions to update worksheet titles Read More »
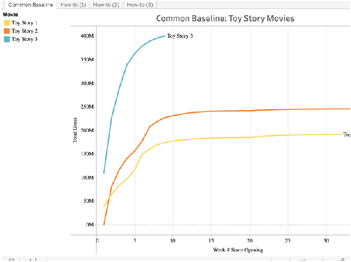
This is a pretty old post, but it’s never a bad time to refresh your memory of the Top 10 table calculations, and this post, originally written by Ellie Fields,
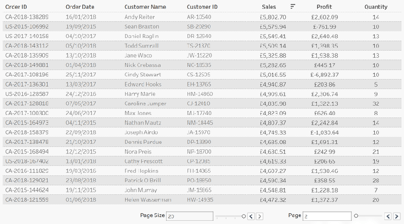
In this Tableau quick tip, Toan Hoang talks us through a simple technique for Table Pagination in Tableau, in 5 minutes or less. Read Original Article…
“The idea of this blog post is to simply show users different ways of performing a single function (such as creating a calculation).” By Kevin Flerlage. Read Original Article…
More Than One Way to Skin a Cat…in Tableau (Part 1) Read More »
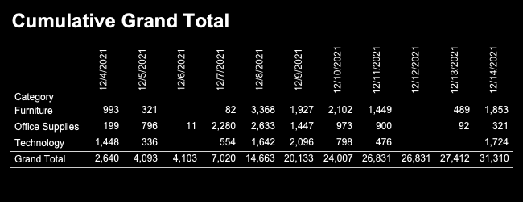
“Here is a use case at work where the grand total of a table needs to be accumulated horizontally to the right.” Post by Alexander Mou. Read Original Article…
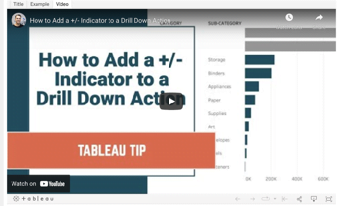
In this tip, Andy Kriebel shows us how to add an indicator before the selected dimension for a set action. This can also be done with a parameter action Read
How to Add a +/- Indicator to a Drill Down Action Read More »
The term Fill Down is from Excel where we may need to fill all the empty cells below a non-null cell with the same cell value. Excel has a Fill
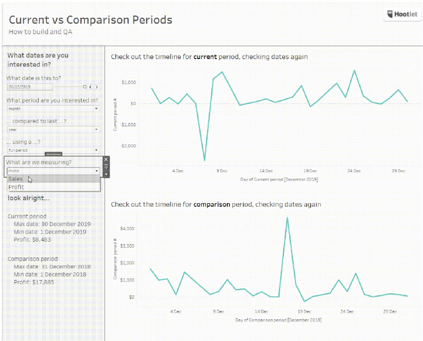
Date comparisons are one of the most common queries to hit our InterWorks Assist team. This two-part blog series will guide you step by step through how to build (and
There are so many incredible hacks and techniques floating out there in the Tableau Universe, it can be difficult to figure out which ones to use and when. Post by
It Depends: Techniques for Disabling the Default Highlighting in Tableau Read More »
