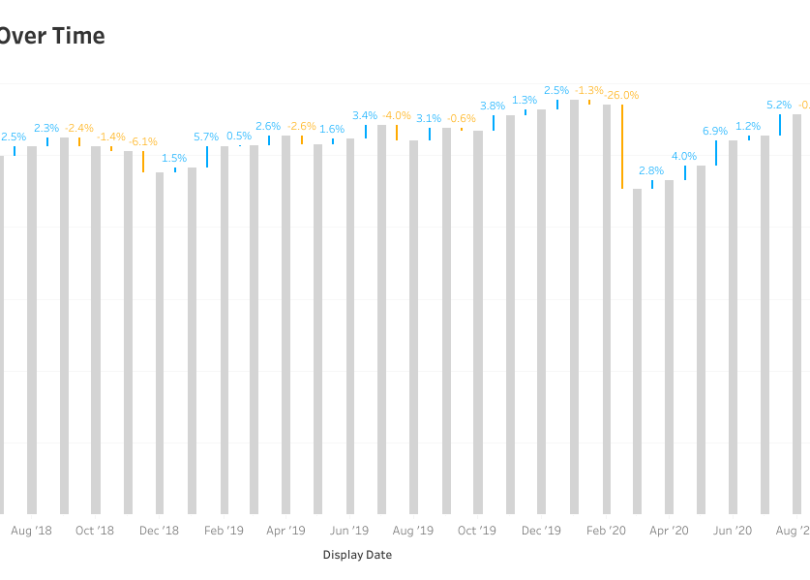
HOW TO CREATE A CROSS DATABASE UNION
Joshua Milligan talks us through a neat workaround to create a cross-database Union – which is currently not supported in Tableau – by using Joins and the MAX function. Even…
Sankey diagrams show the proportional “flow” (or make up) of one dimension from (or within) another. Ian Baldwin of The Information Lab takes us through his 20-step process to create
HOW TO BUILD A SANKEY DIAGRAM WITHOUT ANY DATA PREP BEFOREHAND Read More »
Michael Sandberg interviews the Data Duo, Pooja Gandhi and Adam Crahen, and pulls their top 3 favourite Tableau tips from each of them. The Data Duo have created more than
Mark Jackson chooses this hot topic to introduce a very interesting use of Google Sheets to collect and display data directly through Tableau. Yes, this provides you with the capability
QUIZ : MOST DANGEROUS COUNTRIES FOR MASS SHOOTINGS Read More »
Ryan Sleeper has a series of posts about improving the User Interface on dashboards. This tip covers two approaches for guiding your user from a landing page through various additional
INTRO-STYLE DASHBOARD WITH CROSS-DASHBOARD NAVIGATION Read More »
Tom Pilgrem of the Information Lab’s data school applies KISS to 3 key aspects of dashboard design. It’s always good to be reminded of the basics and how to apply
In this post, Robert Curtis examines sorting on Discrete Measures and adds a few twists to present a bullet-in-bullet chart sorted based on user interaction. This technique also works when
In my training sessions, I warn people about using filled maps for data insights due to the possible issues of visual skewing. In this article Sarah Battersby shows you how
HOW TO USE SPATIAL BINNING FOR COMPLEX POINT DISTRIBUTION MAPS Read More »
What better way to see possibly the most popular new feature of any Tableau launch, Viz in Tooltips, than to see it showcased by Pooja Gandhi. Now in 10.5 –
If that example has inspired you, then take a look at the Viz in Tooltip gallery on Tableau public for more excellent examples. Read Original Article…