
TABLEAU QT: CONNECTED BAR CHARTS
Tableau Magic’s Toan Hoang has a quick tip that will show you how to build a connected bar chart in Tableau in five minutes or less. He uses the Orders…
Tableau Magic’s Toan Hoang has a quick tip that will show you how to build a connected bar chart in Tableau in five minutes or less. He uses the Orders…
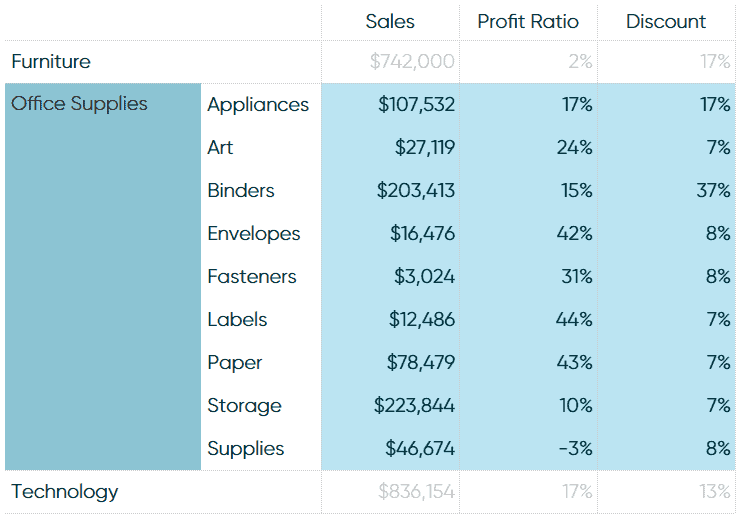
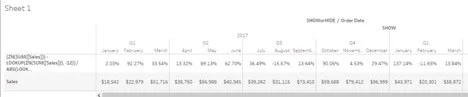
Playfair Data’s Ryan Sleeper explains how to drill into a single row of a text table in Tableau, utilizing the trusty Superstore dataset. The trick to click into a single
HOW TO DRILL INTO A SINGLE ROW OF A TEXT TABLE IN TABLEAU Read More »
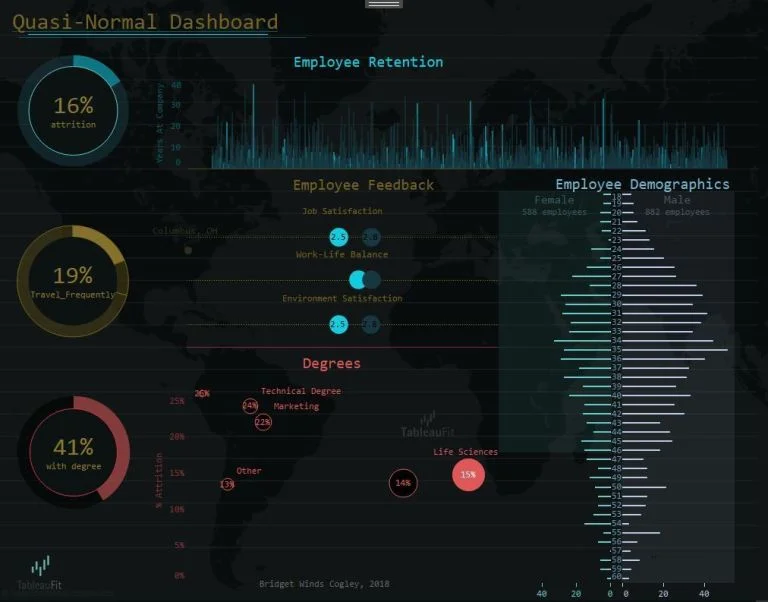
Zen Master Bridget Cogley highlights how we should be designing dashboards for the whole picture. By working together through the charts that make up the dashboard, Bridget emphasises that it
THE LOGIC OF DASHBOARDS: DESIGNING FOR THE WHOLE PICTURE Read More »
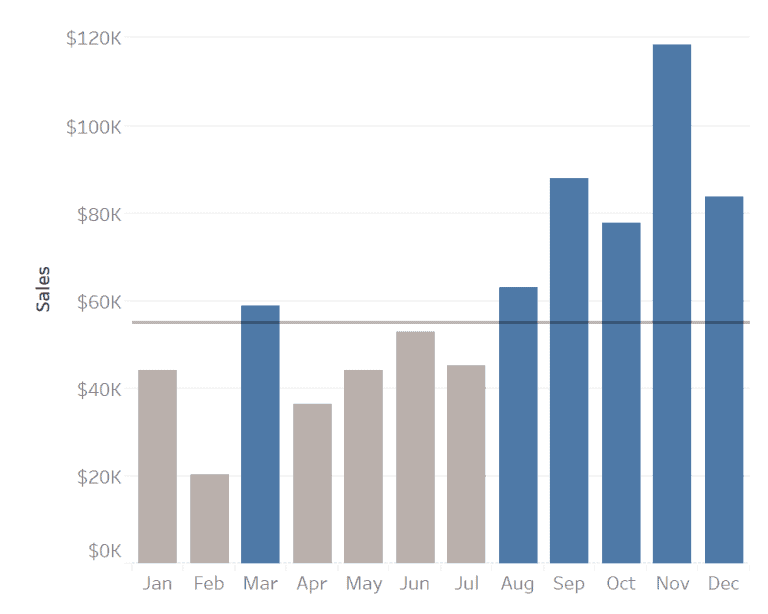
Webranz’s Alex Waleczek questions the use of line charts and bar charts by looking at which chart you should use across different issues such as the usage of ink, the
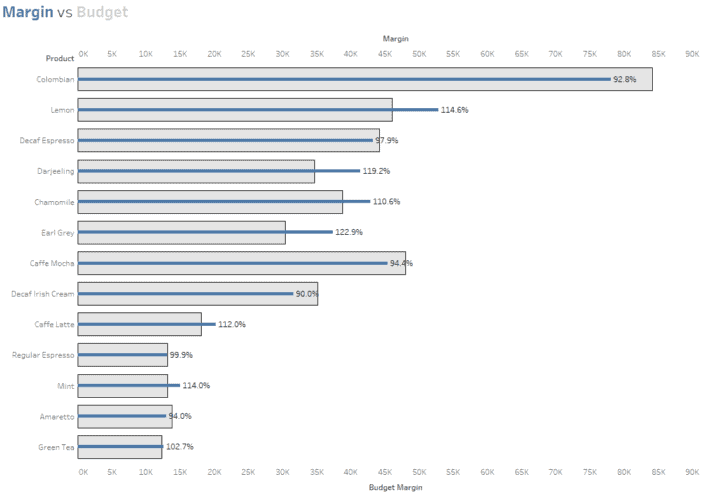
The Information Lab’s Tom Pilgrem uses a bar-in-bar chart to demonstrate how to label the longest of a dual-axis bar chart by using some calculations to make your bar-in-bar charts
HOW TO LABEL THE LONGEST OF A DUAL AXIS BAR CHART? Read More »
Interworks’ Dustin Wyers explains how in Tableau you can fill in null records without needing to use a filter by applying a table calculation to show or hide the data
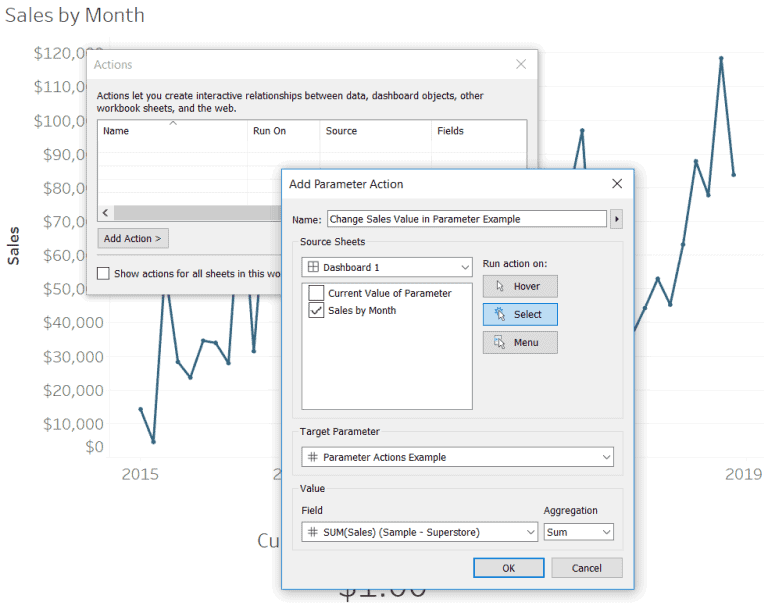
Zen Master Ryan Sleeper identifies three creative ways to use Tableau’s parameter actions. Ryan explains how to use Tableau’s parameter dashboard actions, using parameter actions to highlight selections within a
3 CREATIVE WAYS TO USE TABLEAU PARAMETER ACTIONS Read More »
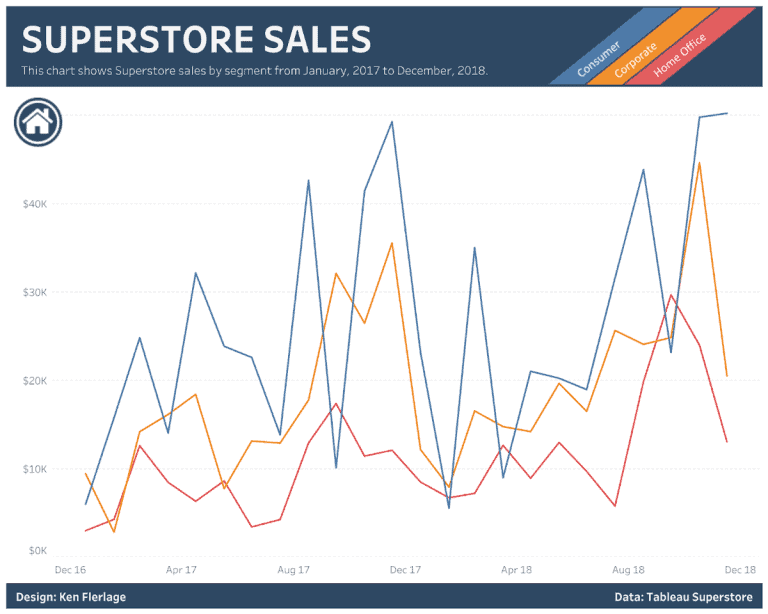
Tableau Zen Master Ken Flerlage highlights eight alternatives to the regular default Tableau legend. The post includes how to integrate the legend into text, custom images, putting the legend into
Tableau’s 2019.3 beta is now available for Tableau users. In the 2019.3 beta, there are three new features to try out, which includes the AI-powered Explain Data, Tableau Catalog and
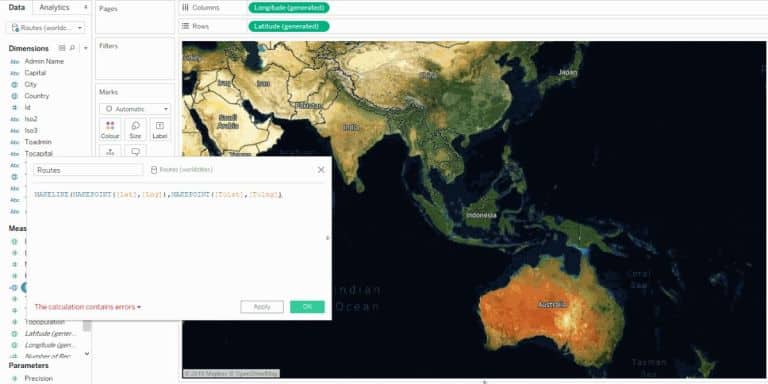
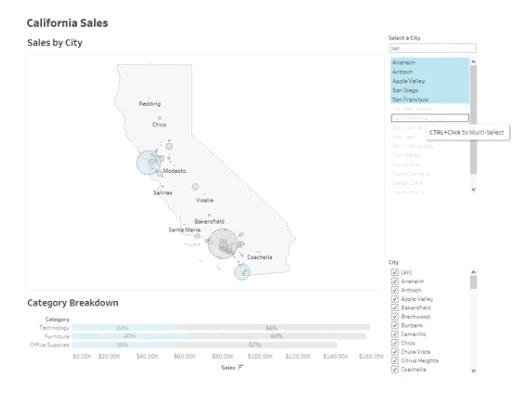
Tableau’s Lead Product Manager for Maps and Spatial Analysis, Kent Marten looks at the two new spatial functions that make analysing location data easier and help elevate your maps to
MAKING GEOSPATIAL ANALYSIS EASY WITH TWO NEW SPATIAL FUNCTIONS; MAKEPOINT AND MAKELINE Read More »
