The F-Word That Makes Dashboards Better
Perfection Feels Productive. It Isn’t. We beat ourselves up more than our stakeholders ever do. A dashboard isn’t “quite right.” A course could be “slightly tighter.” The number isn’t 100%.…
Perfection Feels Productive. It Isn’t. We beat ourselves up more than our stakeholders ever do. A dashboard isn’t “quite right.” A course could be “slightly tighter.” The number isn’t 100%.…

If you’ve been on a long drive with a dodgy sat-nav, you already know what it’s like to learn Tableau. You follow the route, you’re sure you’re nearly there –
Learning Tableau Forever (and Never Quite Being an Expert) Read More »
Dashboards don’t live or die by charts. They live or die by perception. And perception is shaped by framing. Think about two of the most loved brands on the planet: Spotify and LEGO.
The Wow Dashboard Principle: Why Framing Matters More Than the Charts Read More »
I used to think an “insight” was just pointing out the highs and lows. The biggest variances. The odd outliers. Sorry – that was lazy. Those things aren’t insights. They’re data
What Counts as an Insight (and Why Most Dashboards Don’t Deliver Them) Read More »
“This looks great — when can we go live?” You’ve barely finished your first draft. The filters aren’t wired. The tooltips are placeholders. Half the logic is still in your
Dashboards aren’t just built. They’re delivered. Imagine ordering something online and hearing nothing for ten days. No order confirmation. No tracking updates. No expected delivery date. Then, out of the
The Prime Dashboard Delivery Process: Why Perception is the Key to Stakeholder Trust Read More »
Why the dashboards that divide opinion often drive real change… If your dashboard gets applause from everyone, it might not help anyone When a dashboard earns polite applause, vague praise,
How to prevent your dashboard from quietly sabotaging decisions Imagine this. You’ve designed a beautiful dashboard. The metrics are accurate. The filters work. The layout looks clean. But then
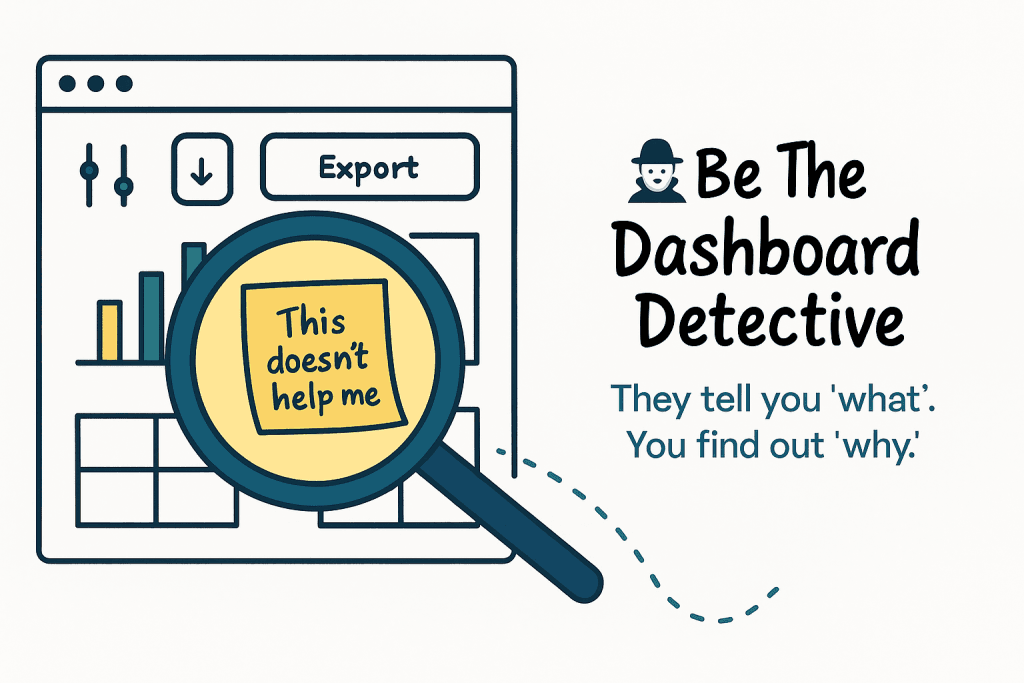
They tell you ‘what’. It’s your job to find out ‘why’. The Brief Isn’t the whole Truth and Nothing But the Truth… When a stakeholder says, “Can I have a
Why your dashboard’s real job begins after it delivers its first wins. You delivered. It worked. Now what? You scoped it well. You built something smart. You refined it with
