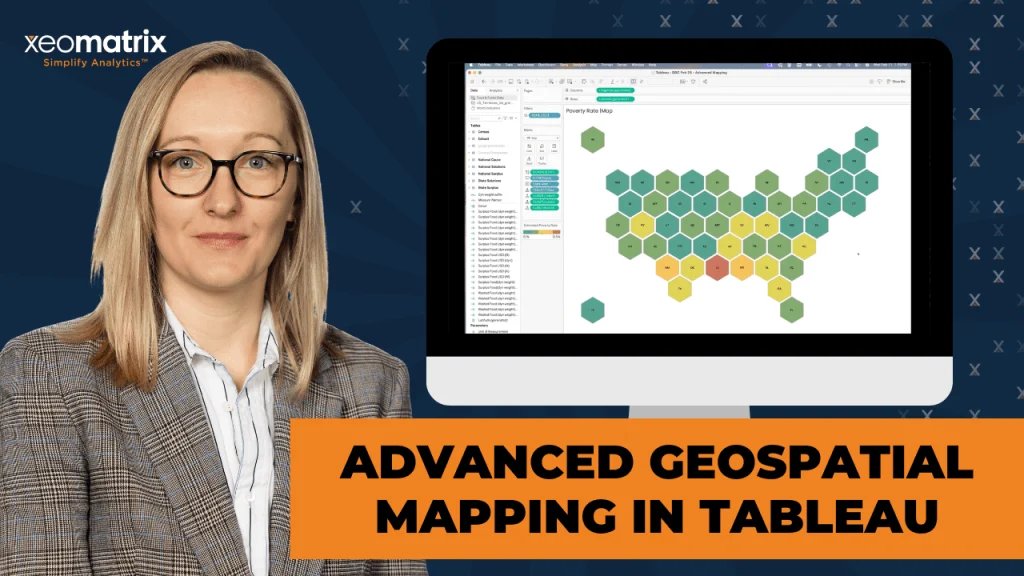
What is a Choropleth map?
Amy Esselman guides you through both the strengths and pitfalls of using choropleth maps. You’ll learn why they work best with normalis ed values (like rates or percentages), how colour…
Beyond the practical hack, Ojoswi Basu’s post also highlights the value of building muscle memory with containers, especially when working at a higher level in Tableau. It’s a great opportunity
Sara and Fi’s post explains the role of Data 360 as the foundation for trusted, unified business data and shows why combining it with semantic modelling and AI creates a
How Tableau Next & Data 360 Turn Business Data into Value Read More »
Dan Jewitt connects the why and how of Tableau Server at a practical level. Beyond just a definition, you’ll get a sense of the kind of capabilities it unlocks like
Eric Parker breaks down each step with real-world examples that show how different total combinations can illuminate your data in ways simple aggregations can’t. Whether you’re preparing financial reports, operational
How to Add Multiple Totals to a Table in Tableau Read More »
Here’s a chance to draw inspiration from some of the most creative data work being done today. Each qualifier entry reflects its author’s unique perspective, research, and design choices, offering
With Chris McClellan and Sekou Tyler, you’ll get exposure to both fundamental skills and more advanced topics that many people struggle to learn on their own. By watching, you’ll be
If you’re interested in using Tableau to tell stories that matter, this is a must-watch. You’ll learn how these creators approach purpose-driven visualisation, combine data with empathy, and design vizzes
Interacting with real dashboards like this, by Heather Cox, helps you see how charts, design, and narrative come together to communicate insights clearly – something that’s valuable whether you’re building
Anirudh Somadas explains how defining metrics once in a reusable MCP skill means faster, more consistent insights and less dependency on engineering – a big win for analytics teams scaling
Extending Tableau MCP with Organization-Specific Drop-In Tools Read More »