Design | 22 Aug 2023
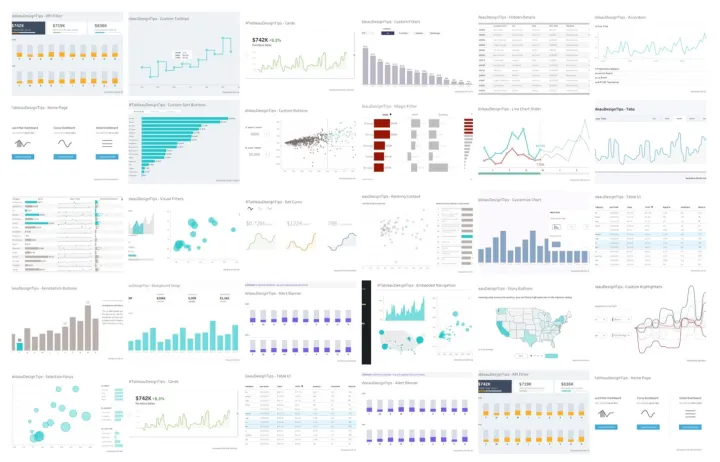
In today’s session we finished looking at different variations of presenting data in tables.
In today’s session we finished looking at different variations of presenting data in tables.
In today’s session we finished looking at different variations of presenting data in tables.
In today’s session we finished looking at different variations of presenting data in tables.
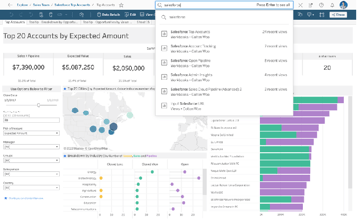
Michael Hetrick shares with us the 2022.2 highlights.. Read Original Article…
“This week’s theme is inspired by a recent family holiday to Norfolk, where I spent most of my time staring out to sea and shouting “there’s one!” every time a
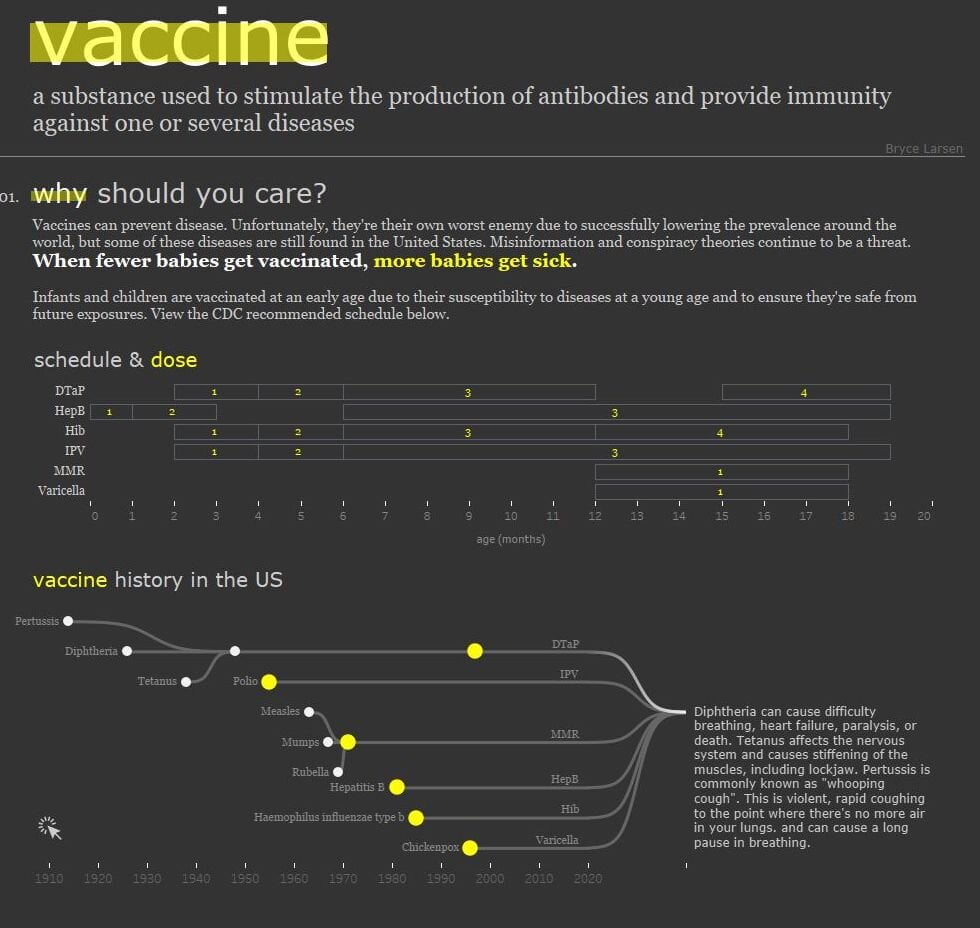
Bryce Larsen shares his entry for Iron Viz, health and wellness being this year’s theme… Read Original Article…
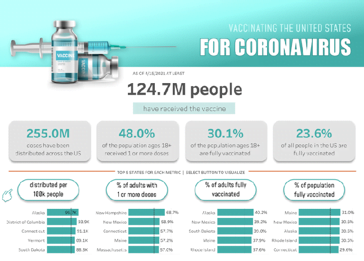
“With various COVID vaccines now becoming available around the world, many organizations and individuals have created data trackers, visualizations and dashboards…” See Lindsay Betzendahl’s dashboard that she designed and built.
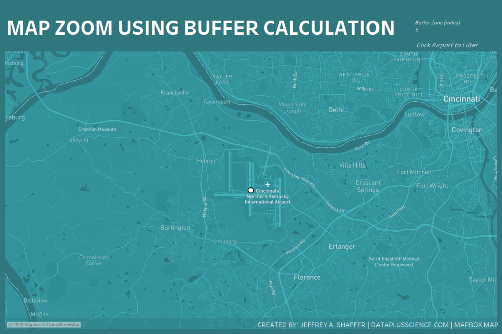
Last year Jeffrey A. Shaffer wrote a blog post showing us a technique used to create a custom map zoom, by plotting a circle around a given point at a
Zak Geis loves design and finding new ways to think of something, to bring inspiration from multiple places and to then combine them into something unique. In this article, Zak
In this post, Brandi Beals dives into how we determine what content to focus on at meetings (her previous post being how she organises meetings for the Milwaukee Tableau User
