Post by Eva Sabinga and Erin Waldron “With cognitive load as our guide, we use twelve unique spectrums to gauge the complexity of our data on one side, identify the needs of our audience on the other, and then calibrate our visualization to successfully bridge the gap between the two.”
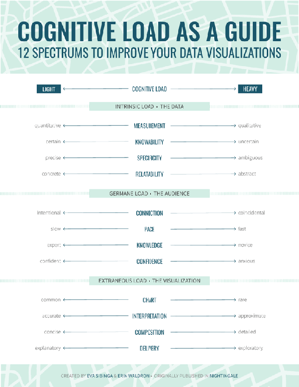

Tableau Training on
Tap Fast Track

Tableau Advanced Analyst

Tableau
Foundation

