Francesca Plaskett’s article combines the “why” and “how”. You’ll get a clear rationale for using dynamic chart selection (e.g., cleaner dashboard space, making insights more discoverable) and a walk-through of implementing it with parameter-driven logic, calculated fields and design choices. If you’ve ever wondered how dashboards can feel more “alive” and less static, read on for ideas you can apply to your next project.
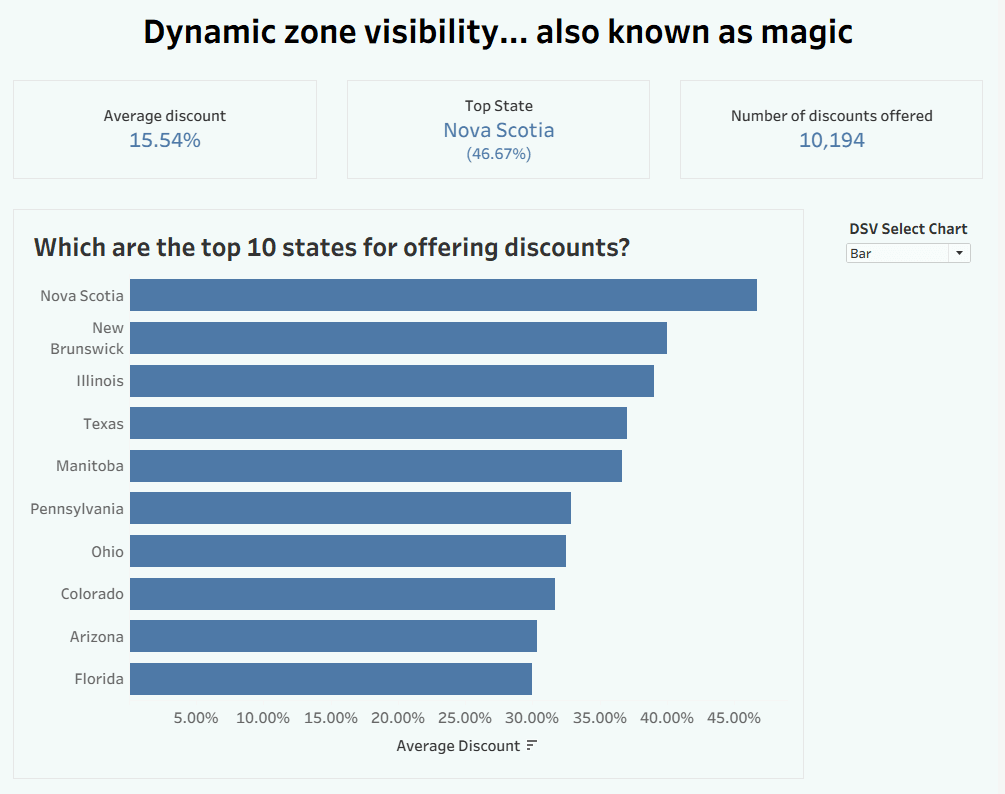

Tableau Training on
Tap Fast Track

Tableau Advanced Analyst

Tableau
Foundation

