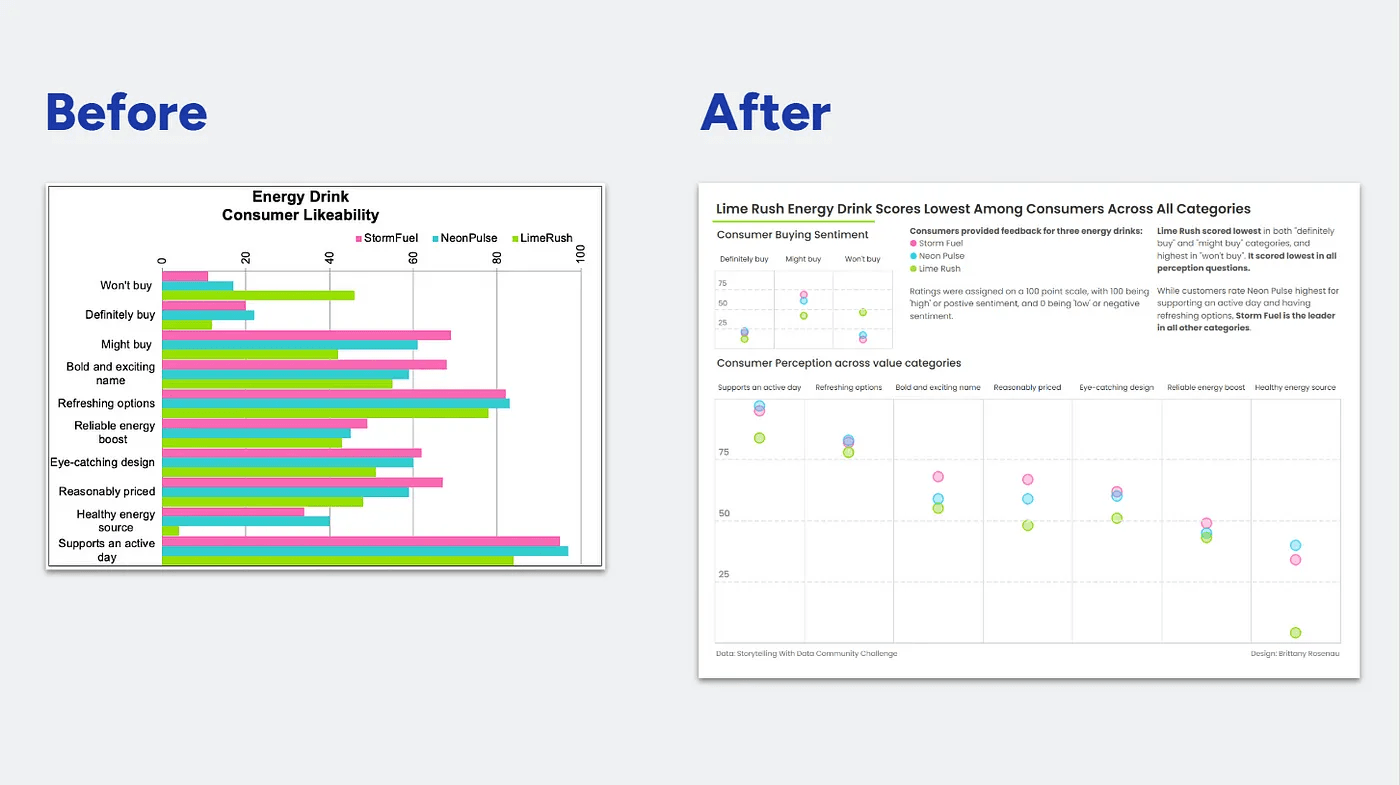
Bar charts are one of the most common and powerful data visualisation tools, but poor design choices can reduce their effectiveness. Johan de Groot’s insightful post walks you through the basics of deep-cleaning bar charts. You could be dealing with unnecessary gridlines, misaligned labels, or distracting colours, his tips will help you refine your visualisations for maximum impact.
Even small adjustments can transform an average chart into a highly effective one. This post is perfect for data analysts, business professionals, and visualisation enthusiasts who want to create cleaner, more professional-looking charts. Don’t let poor formatting weaken your message – learn the essential techniques to polish your bar charts and communicate data more effectively!


