As data professionals, we’ve all heard it:
“Don’t use red and green in dashboards – people with colour vision deficiency won’t be able to tell the difference.”
Fair. But incomplete.
The truth is, you can use red, amber, and green – responsibly.
Why RAG Still Works
RAG status indicators (Red, Amber, Green) are deeply embedded in business reporting. Executives love them.
✅ They’re familiar
✅ They communicate urgency at a glance
✅ They help people act faster
Rather than banishing them, we should be learning how to use them accessibly.
The Colour Vision Challenge
Around 8% of men and 0.5% of women live with some form of colour vision deficiency (CVD) – the more accurate term for what’s often called “colour blindness.”
The most common type, deuteranopia, makes it hard to distinguish red from green – especially in continuous gradients or when saturation is low.
Better Design for Everyone
Here’s how to make RAG work and be inclusive:
✔ Use discrete colours, not gradients
Avoid continuous red–green scales where shades blend into each other. Go for clear, separate colour blocks.
✔ Pick colour-blind-safe palettes
The IBCS palette is a great example. You can test your colours using ColorOracle.org – a free, simple tool that shows you how your palette looks under different types of CVD.
✔ Add tooltips or labels
A small label like “Red = Critical” or hover text ensures users understand the meaning, even if they can’t distinguish the colour.
✔ Give users options
Let them toggle labels or access alternative views – small changes that make a big difference.
Real Example
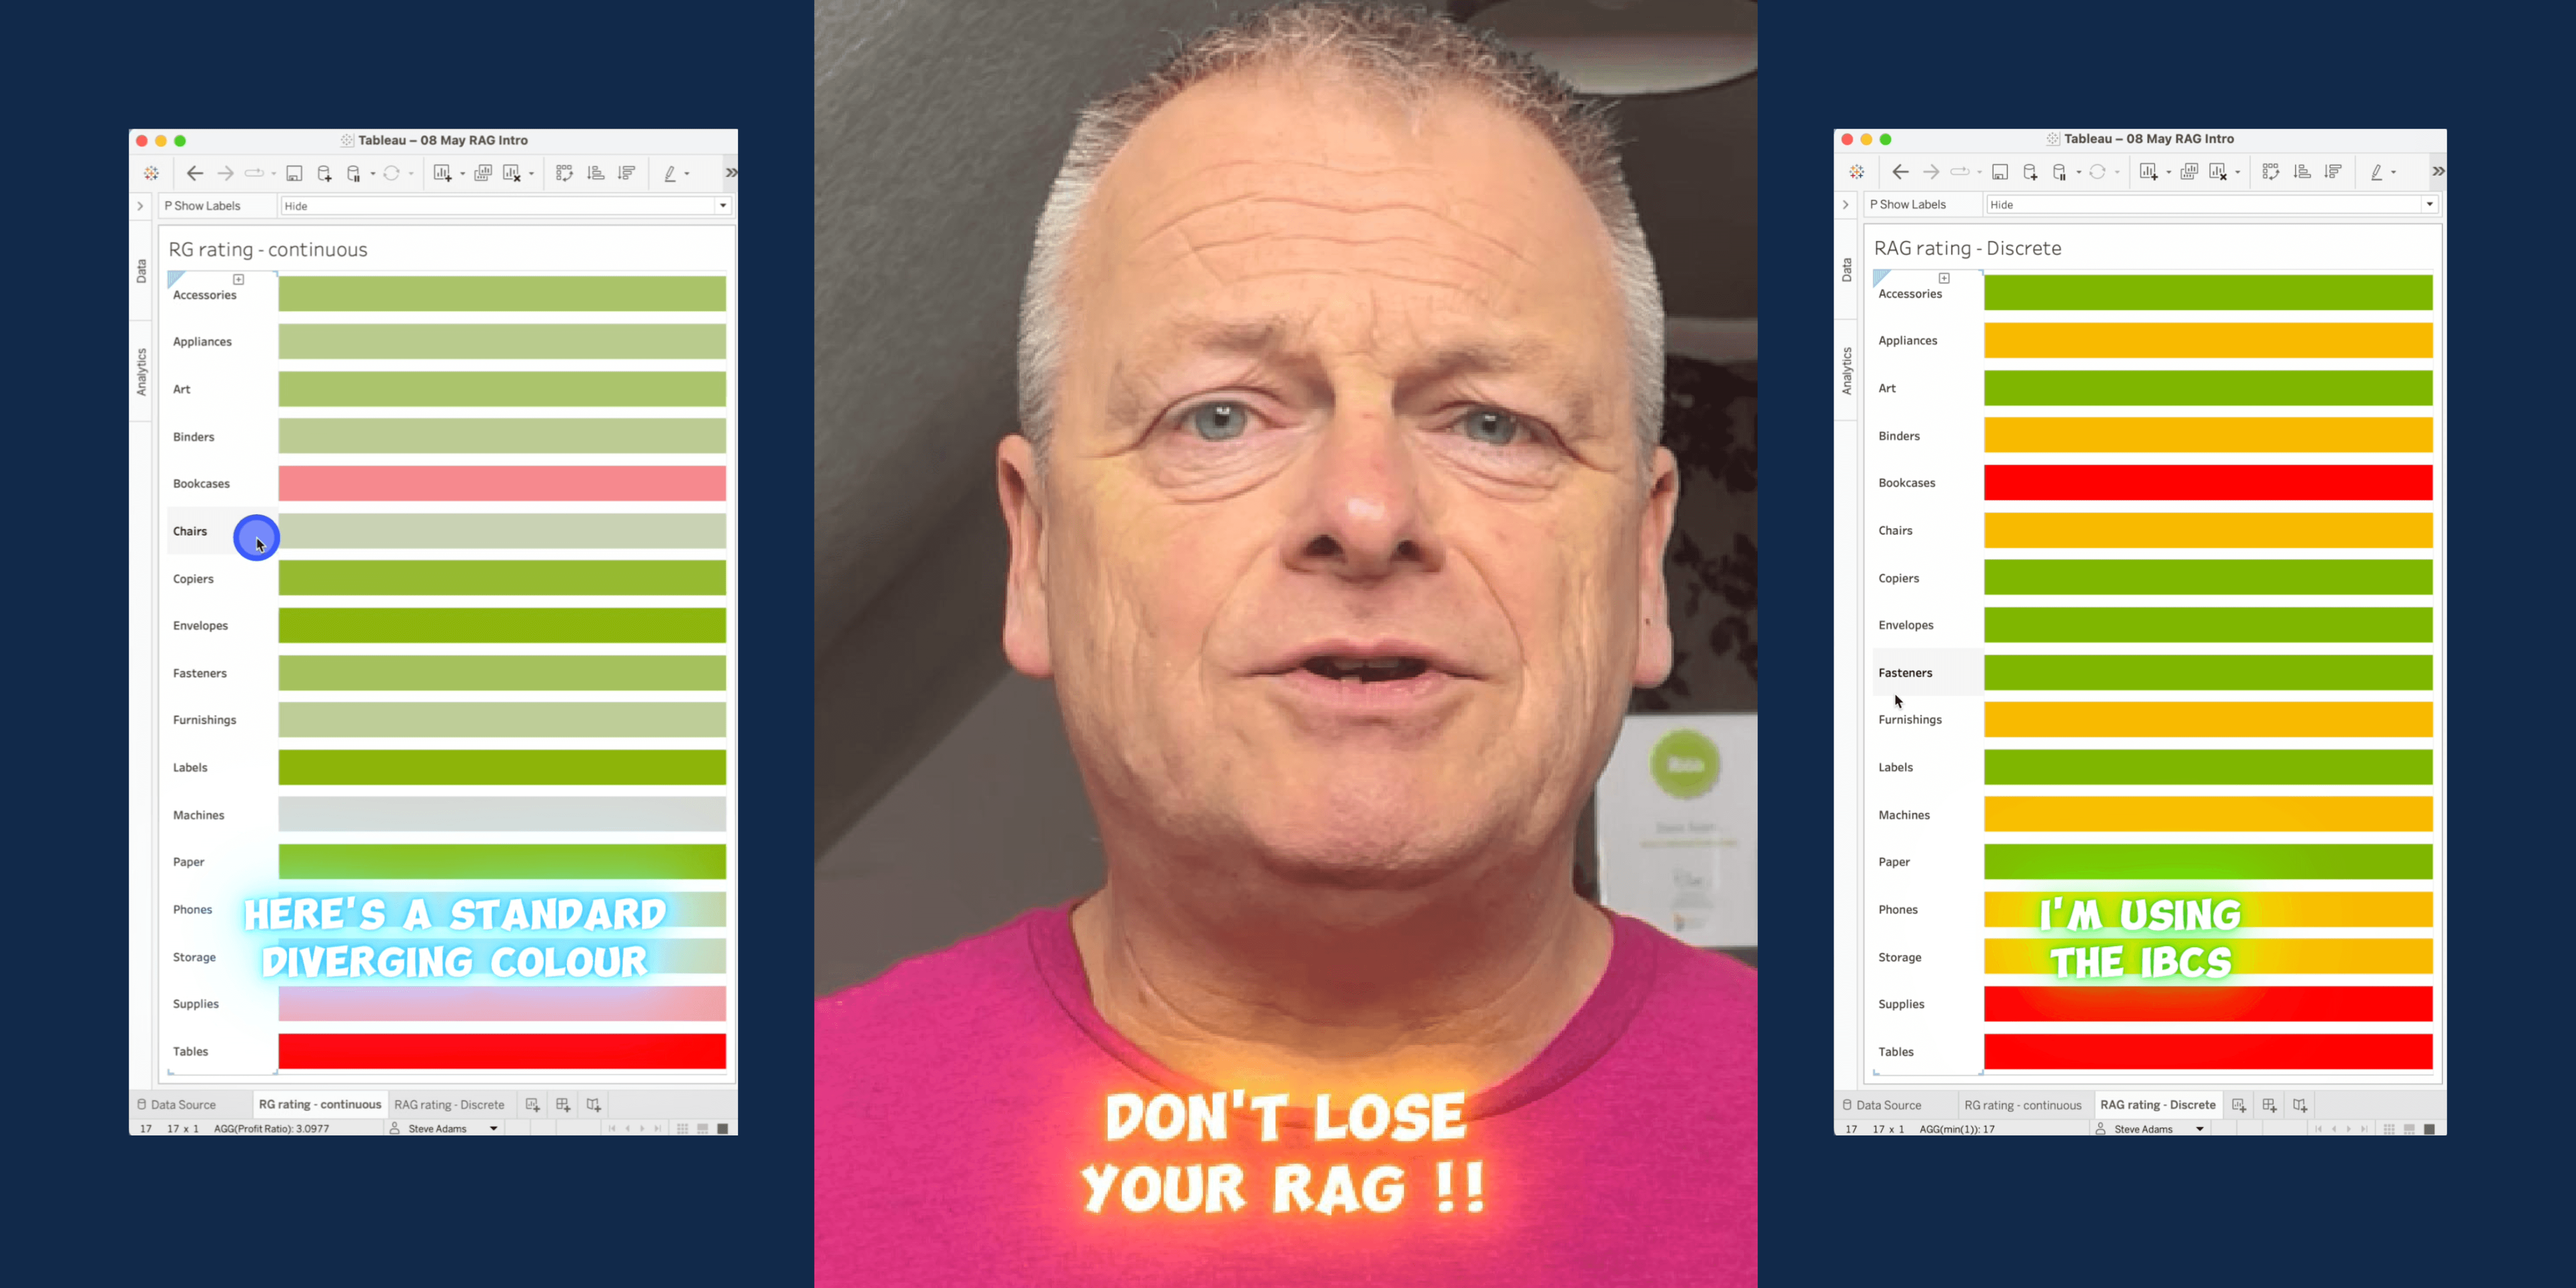
I tested two versions:
- A diverging red–green gradient (looked fine until I applied a CVD filter – then, not so much)
- A discrete RAG scheme using the IBCS palette, which passed the accessibility check
Both showed status. But only one worked for everyone.
🧠 Want to go further?
If you’re serious about levelling up your Tableau dashboards, I’ve got three ways you can go deeper:
🚀 Level Up – Advanced Tableau Course
Sharpen your skills, build faster, and tackle complex design and interaction challenges.
💷 £1,200, 6 half days – here
🎯 Visual Analytics Best Practices
Learn what separates “nice” dashboards from effective ones.
💷 £1,000, 4 half days – here
🌟 Or go all-in: Join the Tableau Insights Community
Get 12 months of access to every course I run, plus weekly coaching, support, and a community limited to just 100 people.
💷 £2,000 total – the best-value option if you want real transformation.
📩 Drop me a message or click here
Thanks for reading – and if you found this helpful, consider sharing it with a colleague or friend who still thinks red-green gradients are a good idea 😉
#DashboardDesign #ColourAccessibility #TableauTips #KPIReporting #InclusiveDesign


