“This looks great — when can we go live?”
You’ve barely finished your first draft.
The filters aren’t wired. The tooltips are placeholders. Half the logic is still in your head.
But because the dashboard looks finished, stakeholders assume it is.
Welcome to the 80:20 illusion:
The last 20% of a dashboard — the polish, the precision, the logic — takes 80% of the effort.
And yet, that’s the bit most people can’t see.
That’s why you need to Drag & Deliver.
The power of slowing down
A little friction early on saves a lot of damage later.
This isn’t just workflow advice — it’s psychology.
When people see something beautiful, they assume it’s also complete.
When they interact with a dashboard too soon, they stop asking if it’s ready — and start asking why it isn’t live.
To avoid this, we need to design in some drag:
- Slow the reveal
- Limit what gets shown
- Surface invisible work
This may feel counterintuitive — especially if you’re used to agile delivery.
But in dashboard projects, speed is deceptive.
Why drag creates value
I’m ‘stealing like an artist’ here, and borrowing a concept from product design psychology:
The Expectation Gap.
This is the emotional chasm between:
- What someone thinks they’re getting
- And what they actually get
When this gap is too wide, you get disappointment. Or worse — scope creep.
Red Bull tastes unpleasant — and that increases belief in its power.
Booking.com slows search results — to boost user trust in the depth of its search.
These are deliberate design decisions that create valuable friction.
Your dashboard process needs the same.
What drag looks like in practice
Here’s how we apply Drag and Deliver inside the Powerful Dashboards framework:
✅ Wireframes first – no gloss allowed
We start with low-fidelity mockups.
No charts, no colours, no filters. Just layout and logic.
Why?
Because wireframes:
- Force the conversation onto structure, not style
- Slow down premature assumptions
- Keep stakeholders focused on purpose and flow
✅ Micro reviews, not mega sign-offs
Instead of unveiling the whole dashboard, we:
- Demo one widget at a time
- Validate a single user journey
- Review one use-case logic in isolation
Why?
Because reviewing everything at once overwhelms the audience and fast-tracks the “that looks done” problem.
✅ Burn-down visuals beat progress bars
Make the invisible work visible.In your project progress reporting for example:
- Colour-code overlays to show logic yet to be implemented
- Use a “build clock” highlighting effort by component (not just feature)
This isn’t about theatrics — it’s about protecting the delivery timeline.
Before. After. Bridge.
Let’s ground this in one of the most effective marketing flows: Before–After–Bridge.
- Before: Stakeholders see early drafts and assume you’re nearly done. This leads to pressure, rework, and misaligned expectations.
- After: With deliberate drag, you gain breathing room, shared clarity, and smoother delivery.
- Bridge: You apply wireframes, micro-reviews, and burn-down visuals to control perception and pace.
Real feedback from the field
Several TIC members have shared how coaching helped them avoid the early-demo trap — especially when dealing with senior stakeholders who expect things to be “done” the moment they look good.
One member said they used to struggle with knowing how to push back on ad-hoc feedback, but now feel confident saying:
“That’s not part of this build — but let me show you where we’re up to.”
Another said the biggest change wasn’t technical — it was learning how to guide review conversations, rather than be led by them.
These aren’t isolated comments.They reflect a pattern we see again and again in our workshops:
People don’t need more speed.
They need permission to slow down — with purpose.
That’s what Drag and Deliver is really about.
Your next dashboard review checklist
Use these five tactics to build in strategic drag at every stage:
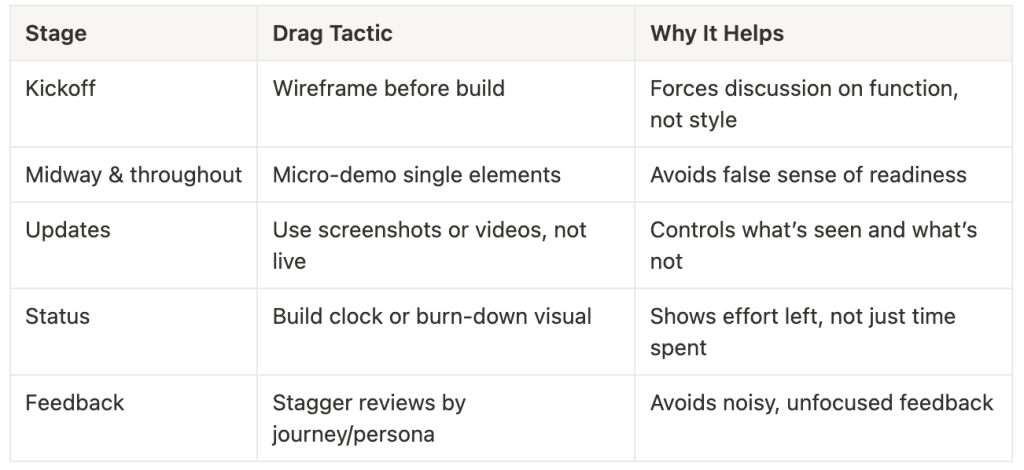
Drag is not delay. It’s design.
When used deliberately, drag:
- Builds trust
- Protects momentum
- Creates better dashboards
Want to go deeper?
Join the Tableau Insights Community (TIC)
We show you how to build faster, better dashboards – and protect your time, your quality, and your sanity along the way.
This article was featured in Tableau’s Weekly Roundup.


