Beyond the visual appeal, Yusuke Nakanishi’s dashboard is also a powerful learning tool. It gives you context: site ages, categories, and geographies, helping you see patterns (for instance, clusters in Europe, Asia, the Americas) and think about what makes a place “heritage.” Anyone who loves stories told through charts and maps, Here is a wonderful example of how data can bring cultural heritage to life in a way a static list never can.
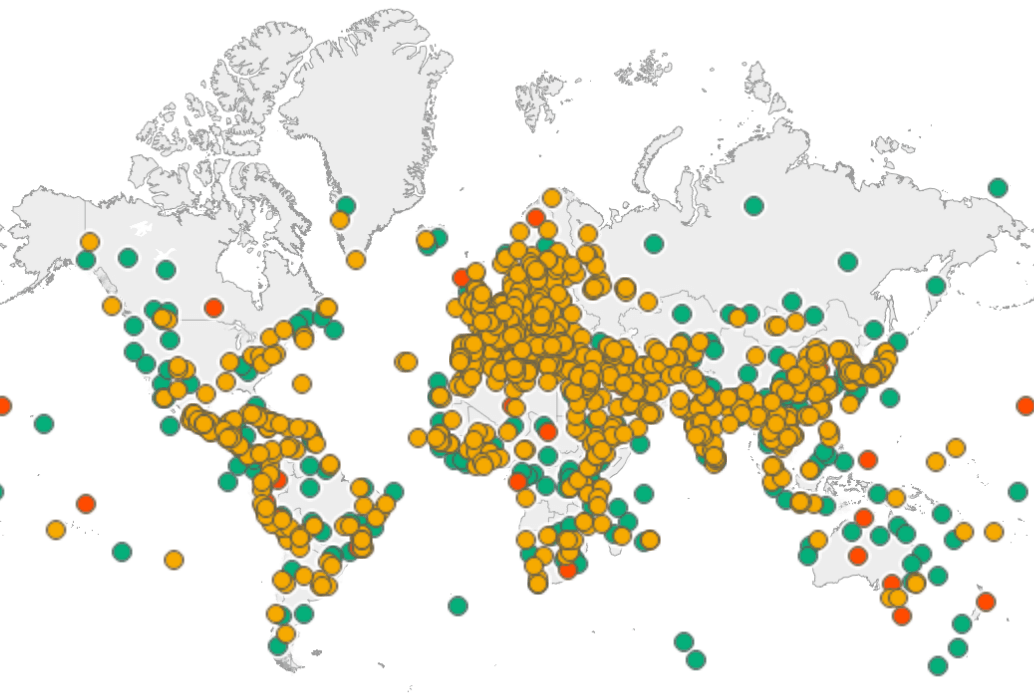

Tableau Training on
Tap Fast Track

Tableau Advanced Analyst

Tableau
Foundation

