Dawn Harrington’s delivery, with a practical, step-by-step approach is what makes this article so useful and is complete with visuals and ready-to-apply Tableau tips. Whether you’re building a geographical report or simply want consistency in your visual storytelling, you’ll be equipped with the tools to handle these tricky map scenarios. If you’re aiming for polished, professional dashboards that include every region of the U.S., you won’t want to skip this!
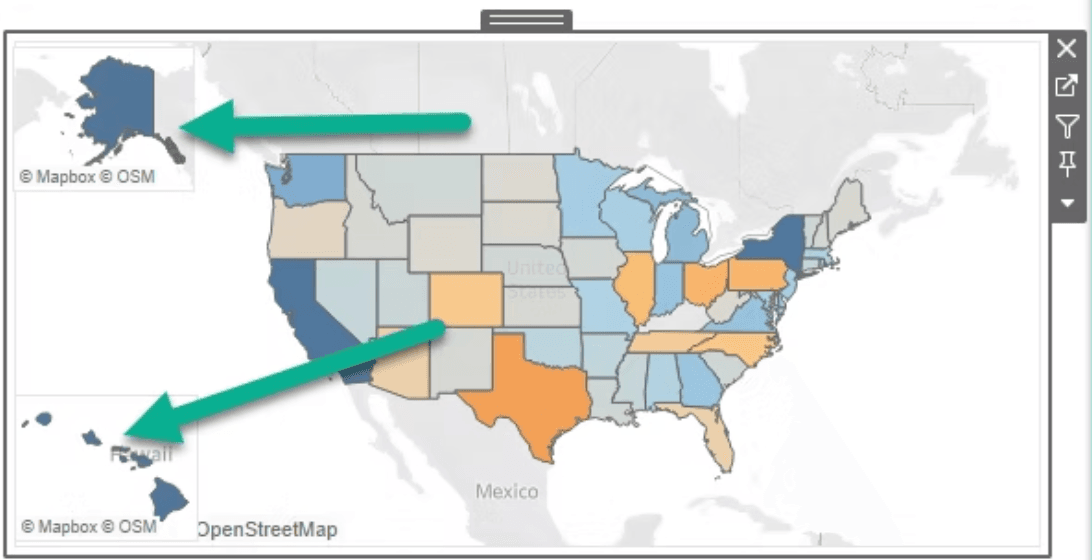

Tableau Training on
Tap Fast Track

Tableau Advanced Analyst

Tableau
Foundation

