Most dashboards get opened.
Very few change what people do.
And if your dashboard isn’t changing decisions, it’s just an admin tool.
A prettier spreadsheet. A digital shrug.
The fix isn’t another feature.
It’s a question. Something like:
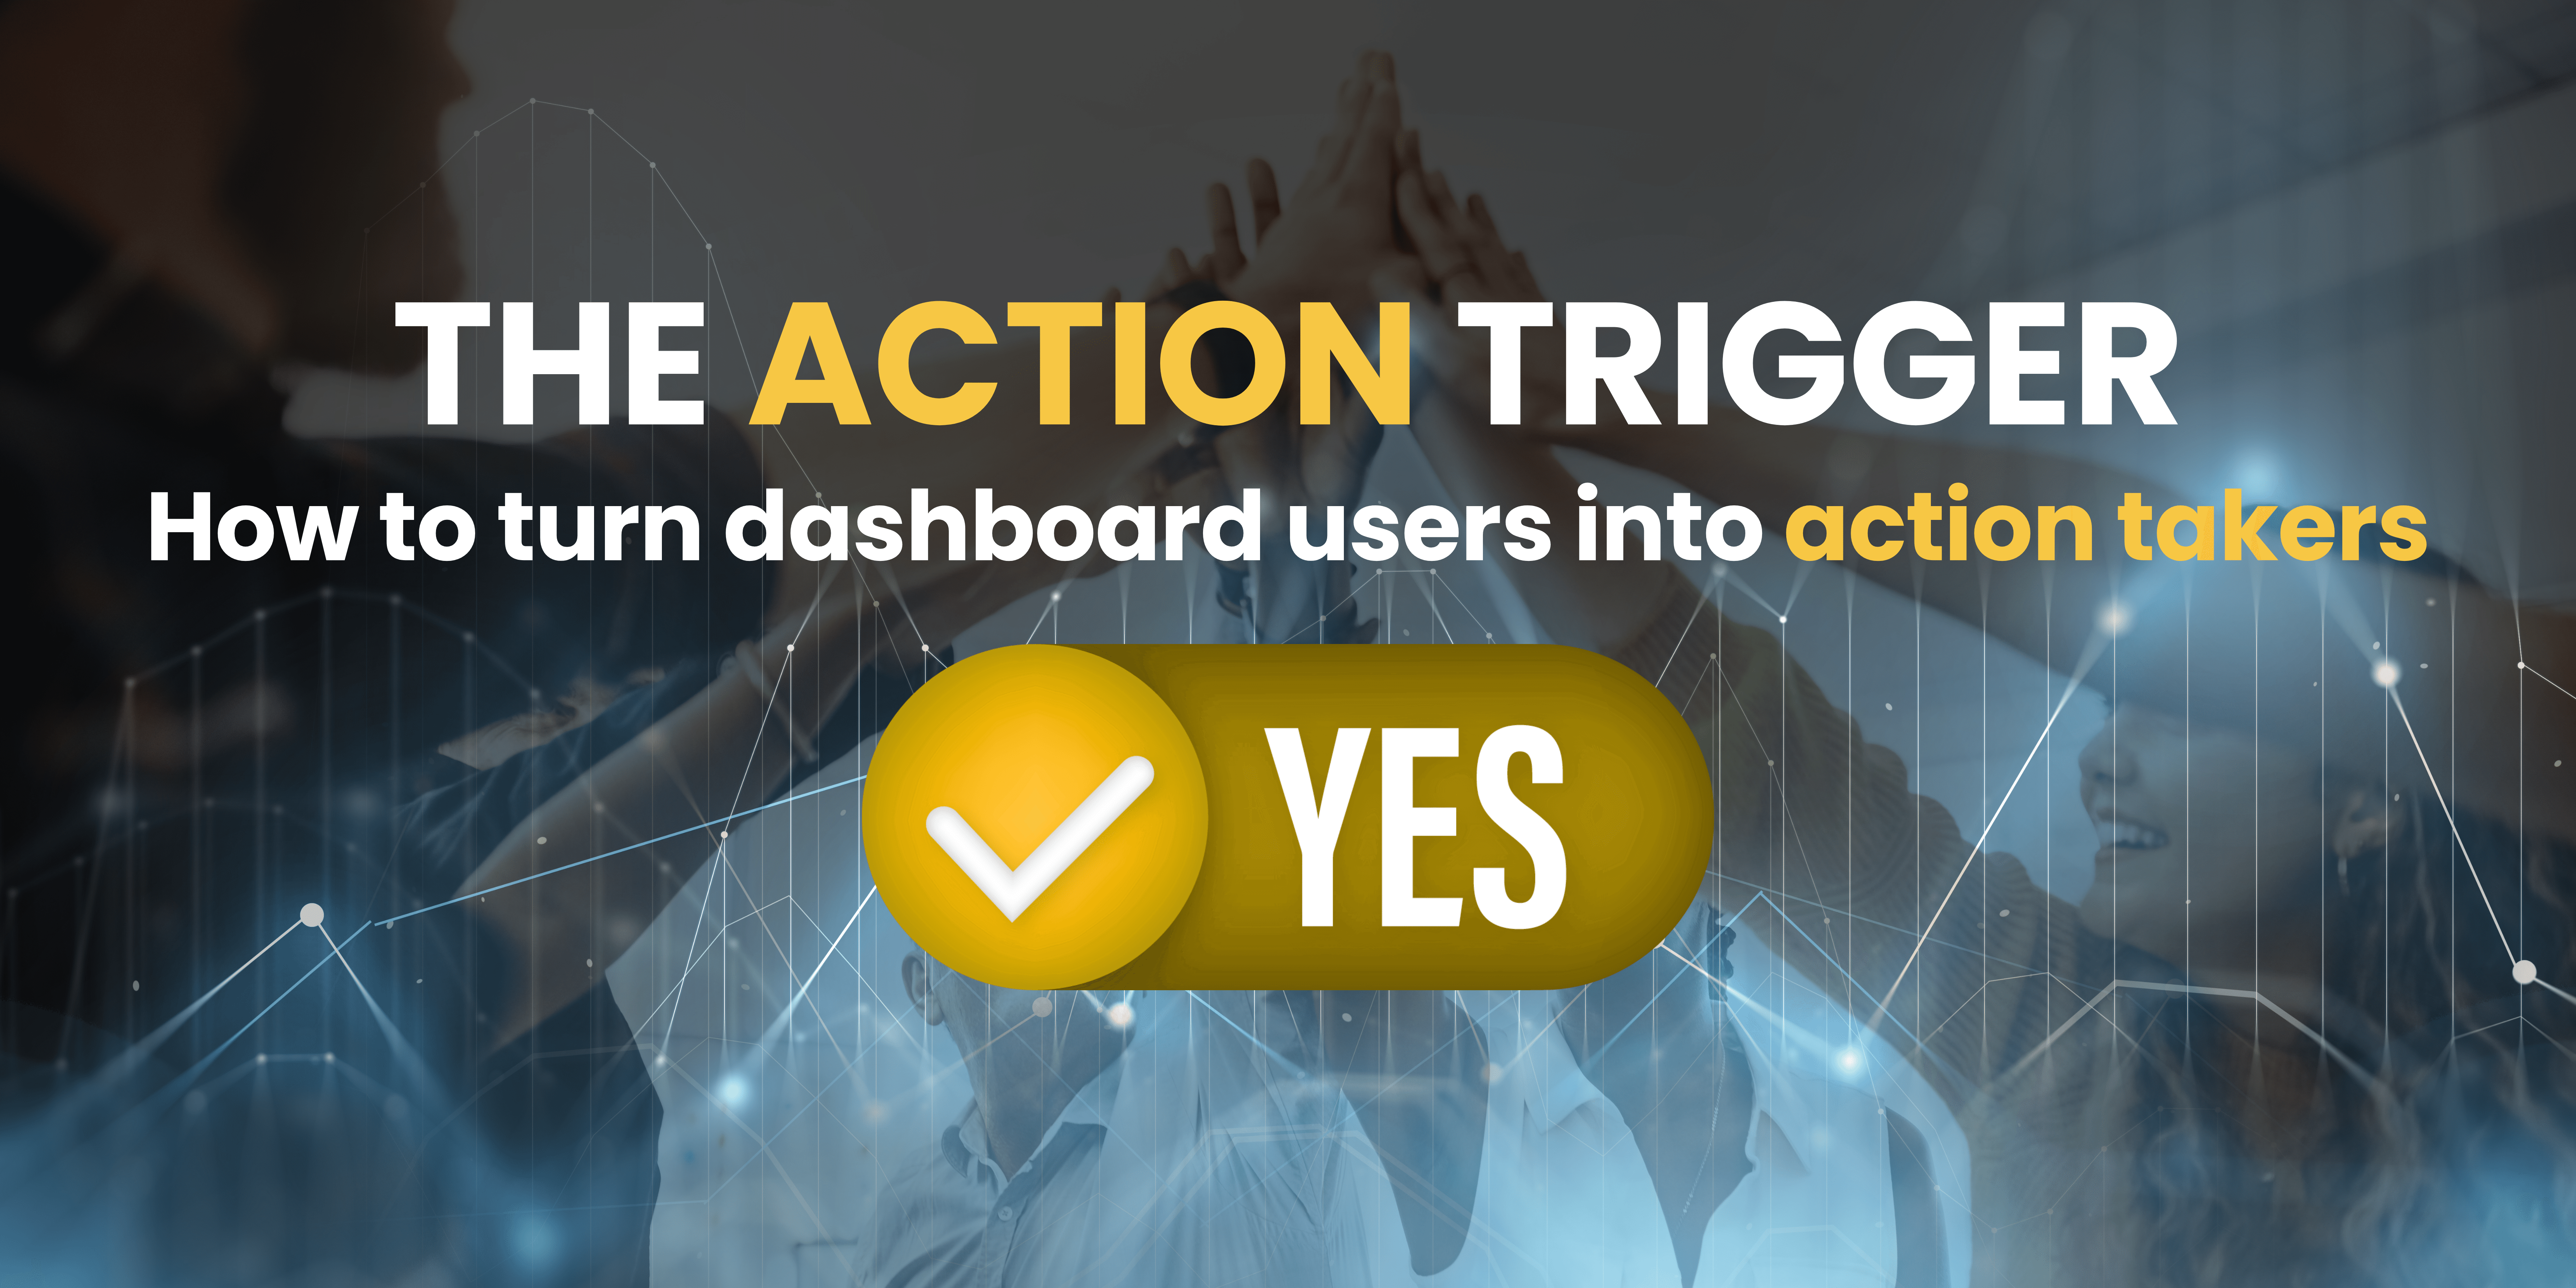
“Will you [take action] to [get result]? Click here”
That one line can change everything.
Not because it’s polite.
But because of psychology.
And the numbers behind it are wild.
The Science Behind the Question
There’s a behavioural science principle known as the Question–Behaviour Effect.
It’s simple:
Ask someone if they’re going to do something – and they’re significantly more likely to do it.
This works because:
Affirmative answers create commitment. We want to stay consistent with what we’ve said.
Cognitive dissonance kicks in if we don’t. We feel uncomfortable saying “yes” and then doing nothing.
The effect can last weeks or months. In some studies, over 6 months.
It’s been proven in:
Health (e.g. asking people if they plan to exercise increases activity)
Politics (e.g. asking “Will you vote?” increases turnout)
Marketing (e.g. asking “Will you try our new product?” boosts conversion)
“Will you take action if we build this feature?”“Will you look at the dashboard before the weekly meeting?”“Will you fix this data if we show you how?”
Ask the question.
Get the commitment.
Then design for it.
That’s what makes it an Action Trigger.
Where to Use The Action Trigger
There’s no single place to ask “Will you take action?”
You can ask it before the dashboard exists.
You can ask it while it’s being used.
And you can build it into the dashboard itself.
Here’s how:
During Design (Scope Agreed)
Before you build anything, test it with the user:
“If we include this metric, will you act on it?”
“Will this help you make a decision you’re currently guessing at?”
“What action would this chart let you take that you can’t take now?”
If the likely answer is vague or passive – cut it. Rethink the question.
After Delivery (MVP Published)
Once the dashboard’s live:
“Will you check this before your weekly stand-up?”
“Will this chart change how you prioritise tasks?”
“What part of this view will help you take your next step?”
These aren’t satisfaction questions. They’re commitment cues.
Embedded in the Dashboard
Use microcopy to embed Action Triggers directly into your UX:
Tooltip: “Will you contact the sales rep if this discount looks off?” → + email link
Sub-header: “Will you fix missing CRM data today?” → + data link
Story Point: “Will this insight change your funding ask?” → + CTA box
Chart title: “Will drilling into [dynamic suggestion] be your next action?”
Alert message: “Will you follow up on these red flags?”
🧠 The Action Trigger Cheat Sheet
Fill-in-the-blank questions that drive action
✍️ During Design
“If I include ___, will you ___?”“Will ___ help you decide ___?”“If this chart showed ___, what would you do next?”“What decisions would this view support?”
📦 Post-Delivery
“Will you check this before ___?”“Will this view affect ___?”“Will you change ___ based on this insight?”“How will you act on this each week?”
🧭 In the Dashboard (UX Copy)
“Will you fix ___?” [link to form/ticket]“Will you contact ___?” [email/phone]“Will you approve/reject ___?” [action prompt]“Will you investigate ___?” [drill-down]“Will you update ___ before next week?” [CRM, HR, Ops field]
Design Like a Car, Not a Filing Cabinet
Opening a dashboard should feel like starting a car.
You turn the key (or click the link)
You check your route (insights, comparisons, filters)
And you follow the GPS to your destination (take action)
But most dashboards aren’t cars.
They’re just maps.
Or worse – they’re filing cabinets with a search bar.
What turns a map into a GPS?
The Action Trigger.
A GPS doesn’t tell you what to do. It asks:
“Will you turn left here?”“Will you reroute around this traffic?”
That’s what your dashboard should do.
Subtly. Smartly. Repeatedly.
Because just like on the road…
Without a destination, people drift.
From Insight to Impact: How Behaviour Creates ROI
Every data project wants impact.
But let’s be real: data doesn’t create ROI. Behaviour does.
All that investment in:
Cleaning the data
Connecting the systems
Building the dashboards
Training the users
…means nothing if no one acts on what they see.
The Action Trigger closes that loop.
It turns passive consumption into committed decisions.
And the good news?
You don’t need 100 charts. You just need one smart question, asked at the right moment.
Make This Your Default Move
Don’t wait until launch day to test if your dashboard will work.
Test it with one question before you build anything:
“Will you take action if I give you this?”
Ask it:
Before you build
When you deliver
While they use it
Right inside the dashboard
Because no trigger = no action = no value.
This is what makes dashboards drive ROI, not just generate reports.
And if you want to get better at building dashboards that do just that…
What’s Next
📓 Read the full blog? You just did.
📩 Join the Tableau Insights Collective (TIC)
You’ll learn to design dashboards that drive behaviour – not just look good.
It’s Pay As You Profit. No fluff. Just results.
👉 Join here!
💬 Interested in levelling up fast?
We’re cooking something hot:
A practical bootcamp with Tableau Visionary Dawn Harrington.
Built for intermediate users who want to move fast using easy-to-use Tableau features.
🔥 Message me “Bootcamp” to get early access before it launches.
Appendix: Sources & Studies
Spangenberg, D. et al. (2003). A meta-analytic synthesis of the question–behavior effect.
Thaler, R., & Sunstein, C. (2008). Nudge: Improving Decisions About Health, Wealth, and Happiness.
Fogg, B.J. (2009). Creating Persuasive Technologies. Stanford Behavior Design Lab.
This article was featured in Tableau’s Weekly Roundup.


