With Andy Kriebel, you’ll learn how to create a Profit Ratio calculation, build the base scatterplot, add reference lines, split the view into four quadrants, and categorise performance – plus explore two different ways to construct the chart. This is a foundational technique you can apply across product analysis, customer segmentation, sales performance, marketing channels, and more.
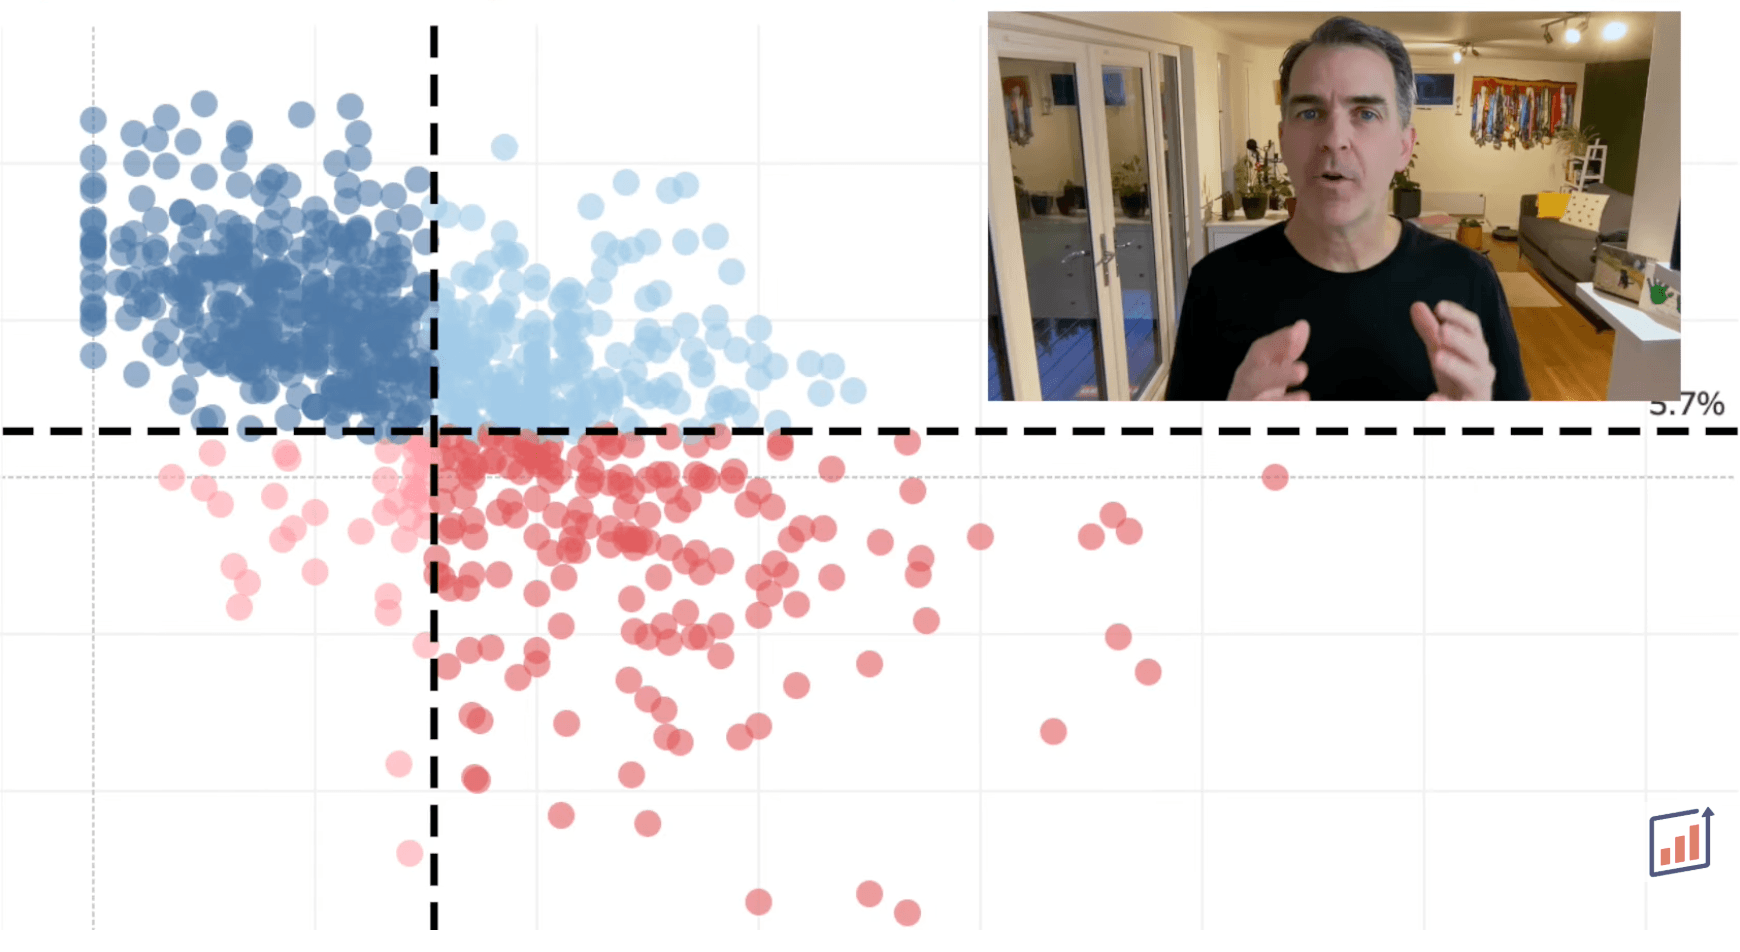

Tableau Training on
Tap Fast Track

Tableau Advanced Analyst

Tableau
Foundation

