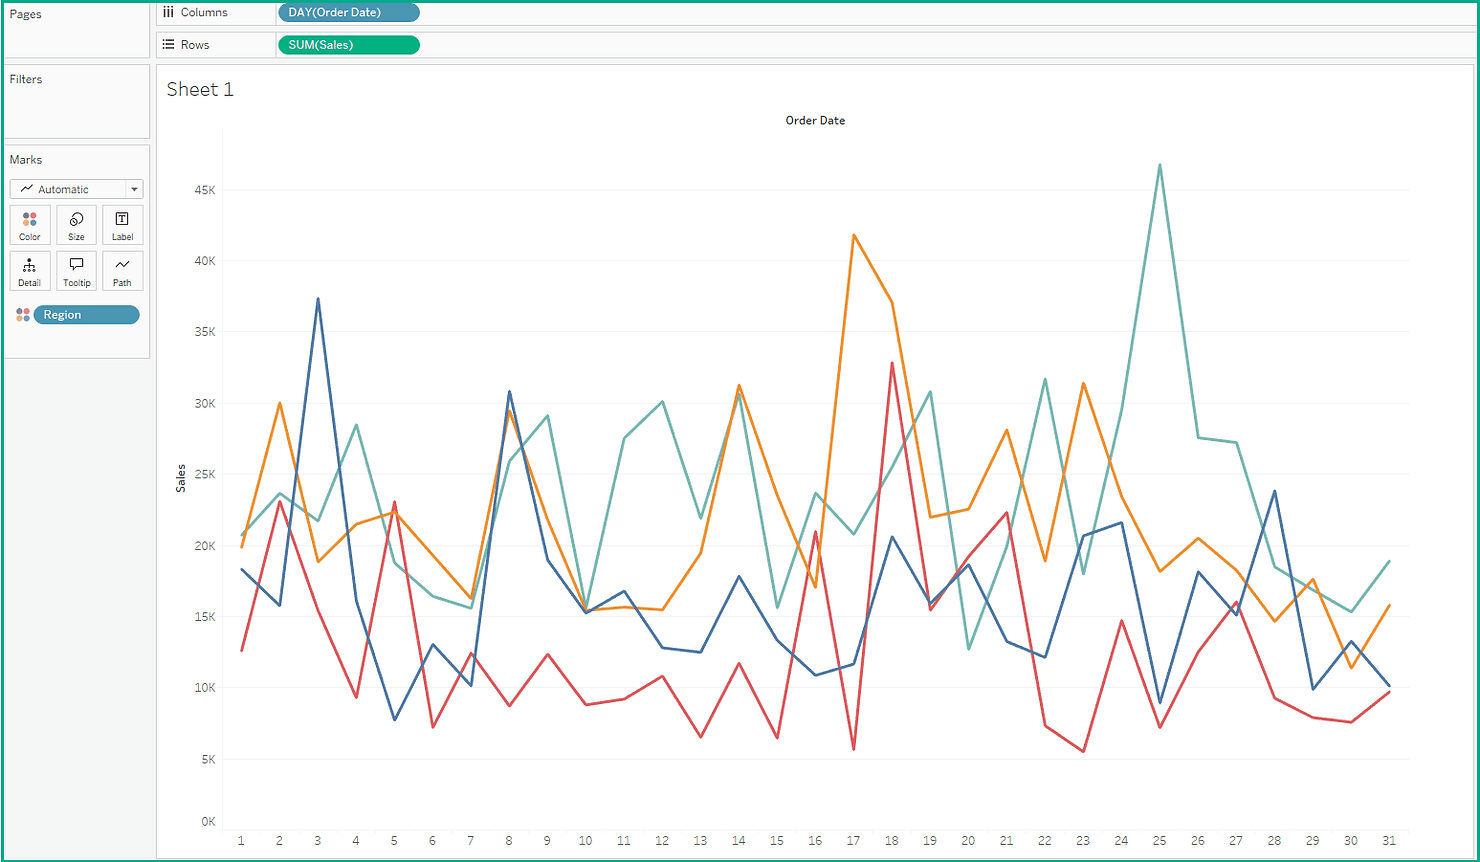
If you’re aiming to add more flexibility to your Tableau dashboards, Dawn Harrington walks you through creating a date filter that allows users to switch between different time levels – day, month, or year – based on their needs. This feature enhances your data visualisation, thus making it more interactive and dynamic for users who need varying levels of detail.
Mastering this technique will not only improve your dashboards but also provide your audience with tailored insights. Whether you’re working on trend analysis or time-based reporting, this guide makes your Tableau work more versatile and user-friendly. Don’t miss the opportunity to boost your Tableau skills. Read on today!


