Especially useful, is how it bridges the gap between “I need a chart to show these numbers” and “I want a chart that can adapt and scale.” Ken Flerlage walks through creating a kind of meta-chart setup: one where, say, changing a parameter or measure triggers a new chart type or layout. If you’re tired of manually rebuilding visuals every time the data changes, or you want to hand a tool to your team so they can self-serve the visuals without breaking things, this is the kind of article that will both inspire and equip you.
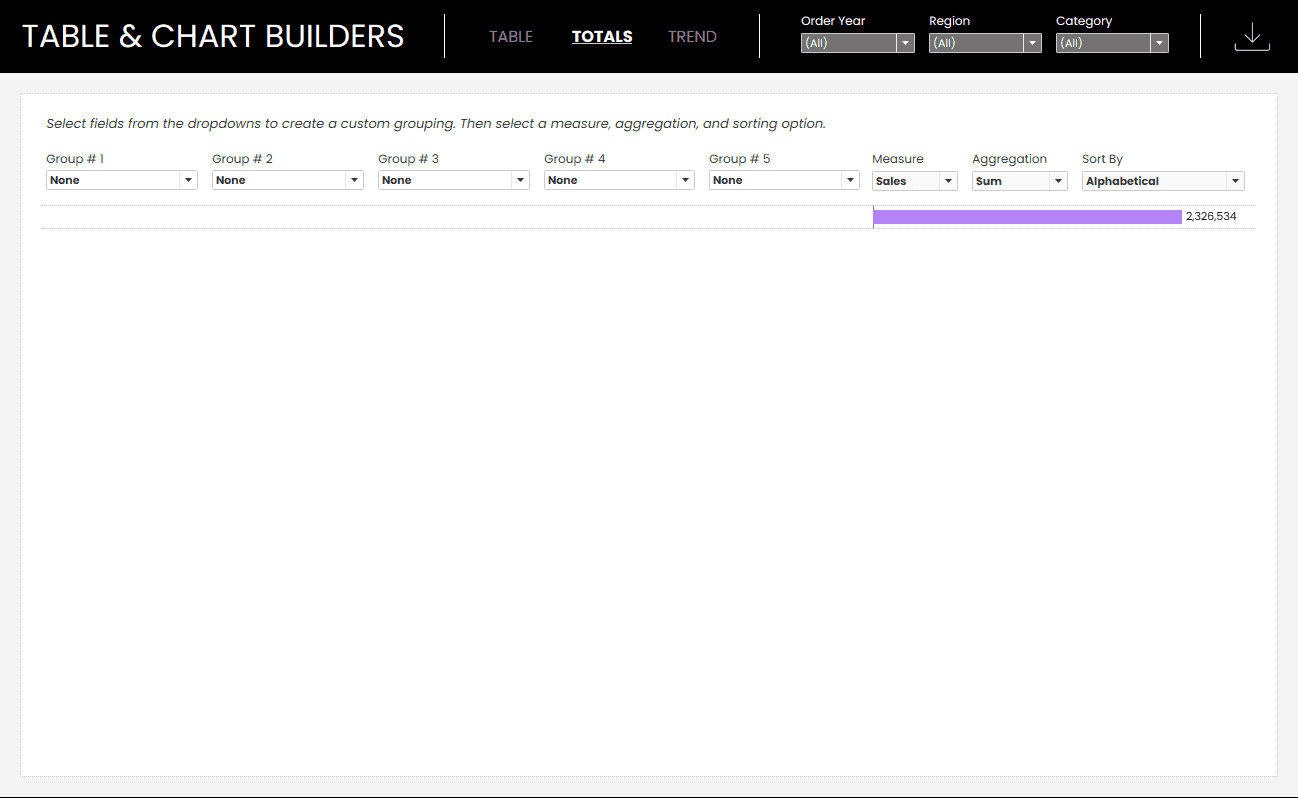

Tableau Training on
Tap Fast Track

Tableau Advanced Analyst

Tableau
Foundation

