Unit histograms, or Wilkinson dot plots, show distributions of individual data points instead of bucketing them into bins like traditional histograms. My friend and Tableau Zen Master Hall of Famer, Steve Wexler, recently suggested this as an alternative on one of my visualizations, and I liked the idea so much that I wanted to show you how to build it in Tableau.
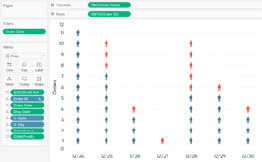

Tableau Training on
Tap Fast Track

Tableau Advanced Analyst

Tableau
Foundation

