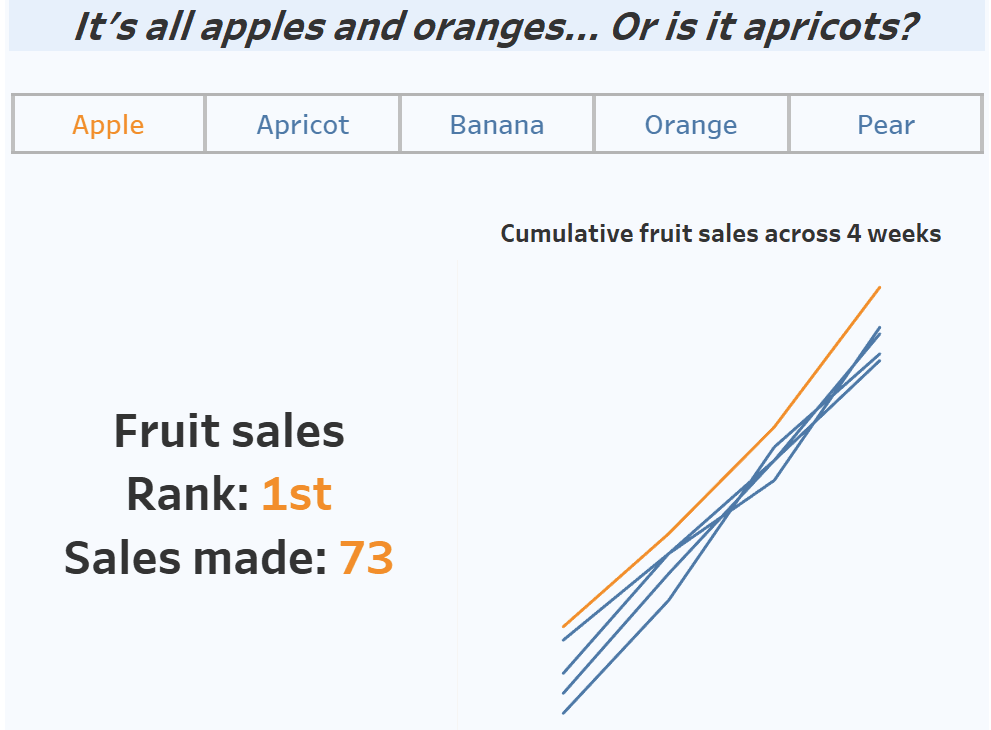
It bridges the gap between what many of us want our dashboards to do (interactive, responsive, user-controlled) and what they actually do (often flat and hard to navigate). By following the steps in Francesca Plaskett’s post, you’ll learn to build dashboards where users can select a category via a bar, then watch the table or visual update to highlight the rank of each element within that category. This piece is well worth the 10 or so minutes to read – and immediate implementation will likely pay off.
It’s all apples and oranges: Using a category bar to filter and show individual ranks in Tableau
Want to Get Latest Updates and Tips on Tableau Bites Blogs
Sign Up For Newsletter


