Dawn Harrington walks you through an example using well-known metrics – like sales, profit, orders, and customer counts, to show how to build effective KPI-driven dashboards with minimal clutter. If you’ve struggled with dashboards that feel messy or too busy, this article gives you a smarter path: a way to surface the most important numbers cleanly, so your reports stay readable, focused, and great-looking!
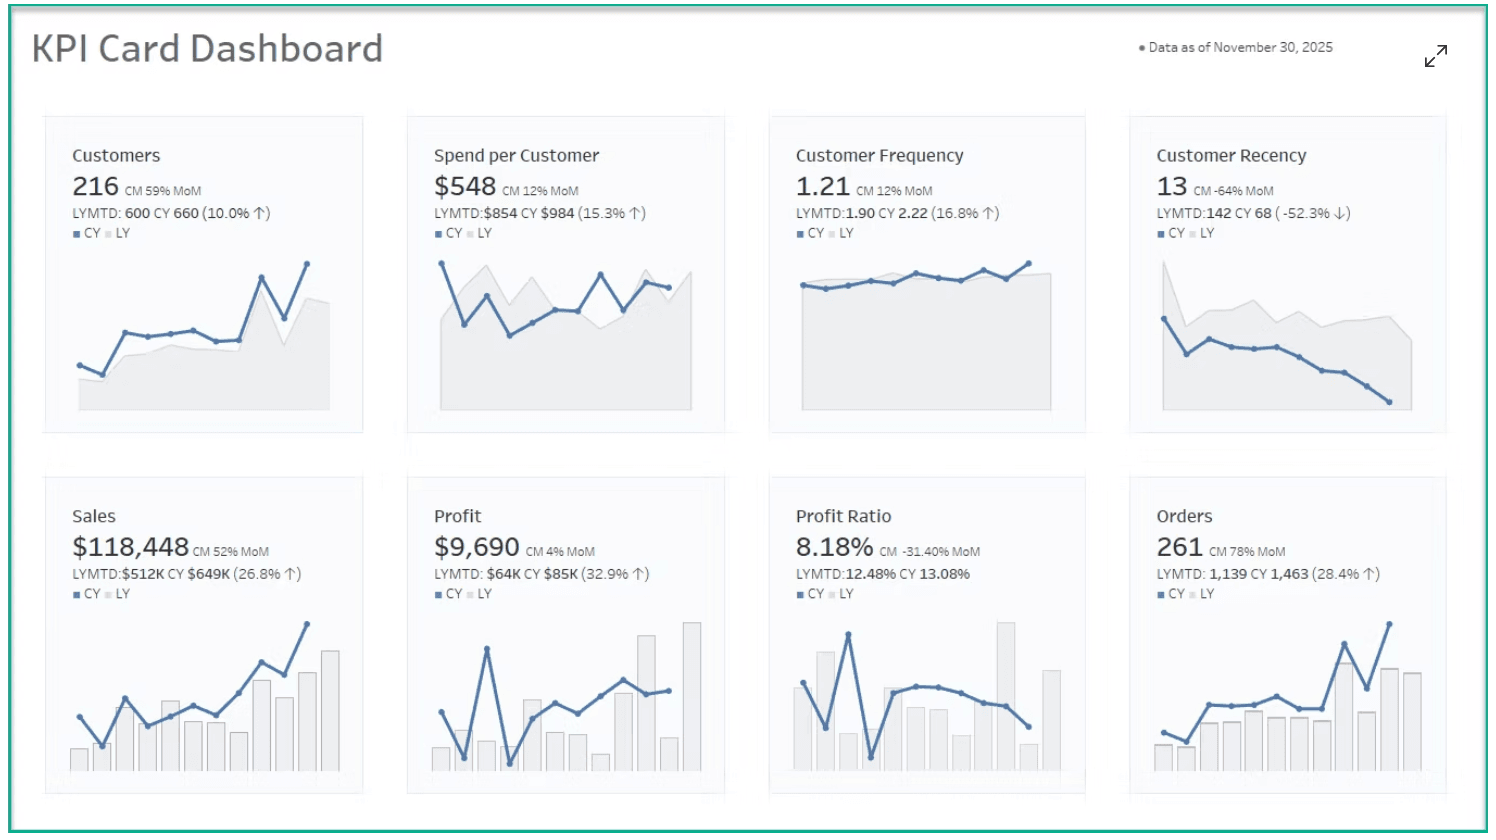

Tableau Training on
Tap Fast Track

Tableau Advanced Analyst

Tableau
Foundation

