Donna Coles unpacks both the why and the how of effective trend monitoring. She breaks down concepts with thoughtful examples that go beyond basic line charts or summary KPIs, giving you ideas for visualising period-on-period comparisons in ways that highlight real patterns and shifts.
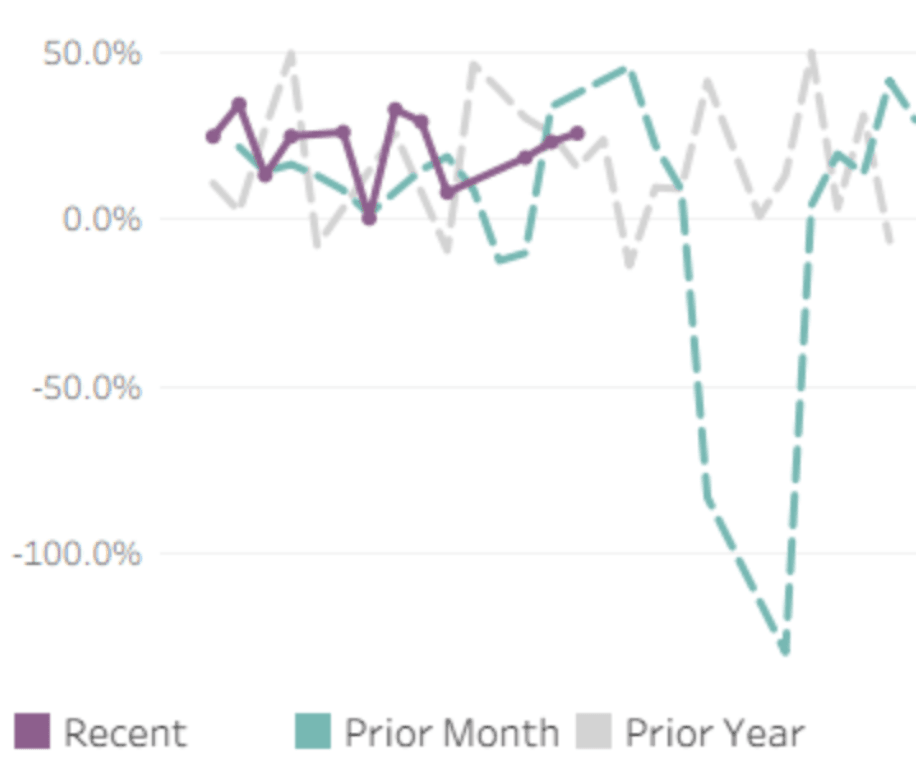

Tableau Training on
Tap Fast Track

Tableau Advanced Analyst

Tableau
Foundation

