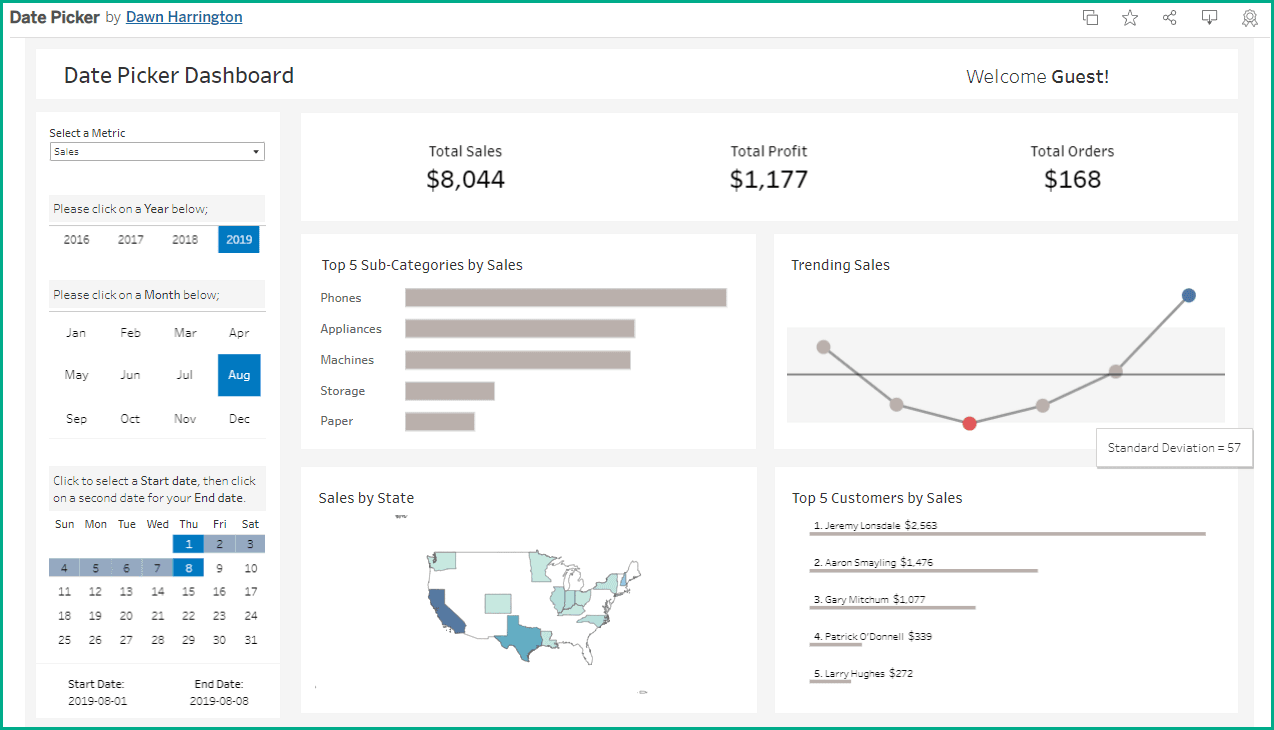
Dive into this post with Dawn Harrington (TechTipsGirl) as she talks us through this often-overlooked topic. She offers practical advice on how to enhance your dashboards by allowing users to easily explore data through customised date ranges. With step-by-step guidance, you’ll learn how to provide better user experiences, making your visualisations more interactive and effective.
Whether you’re a Tableau beginner or a seasoned pro, mastering date selection can make all the difference in how your audience engages with your data. This article provides valuable techniques that can help you transform static date filters into powerful tools for data analysis. Don’t miss this opportunity to sharpen your skills and bring more sophistication and flexibility to your dashboards!


