What makes Francesca Plaskett’s post especially useful is the practical, hands-on approach: you follow each action in Tableau and end up with a chart that adapts based on user selection, not just a static visual. Whether you’re creating dashboards for others or trying to make insights easier to see yourself, these tips will help you make stacked bars that actually communicate what matters, and give you techniques you can reuse in other visualisations too.
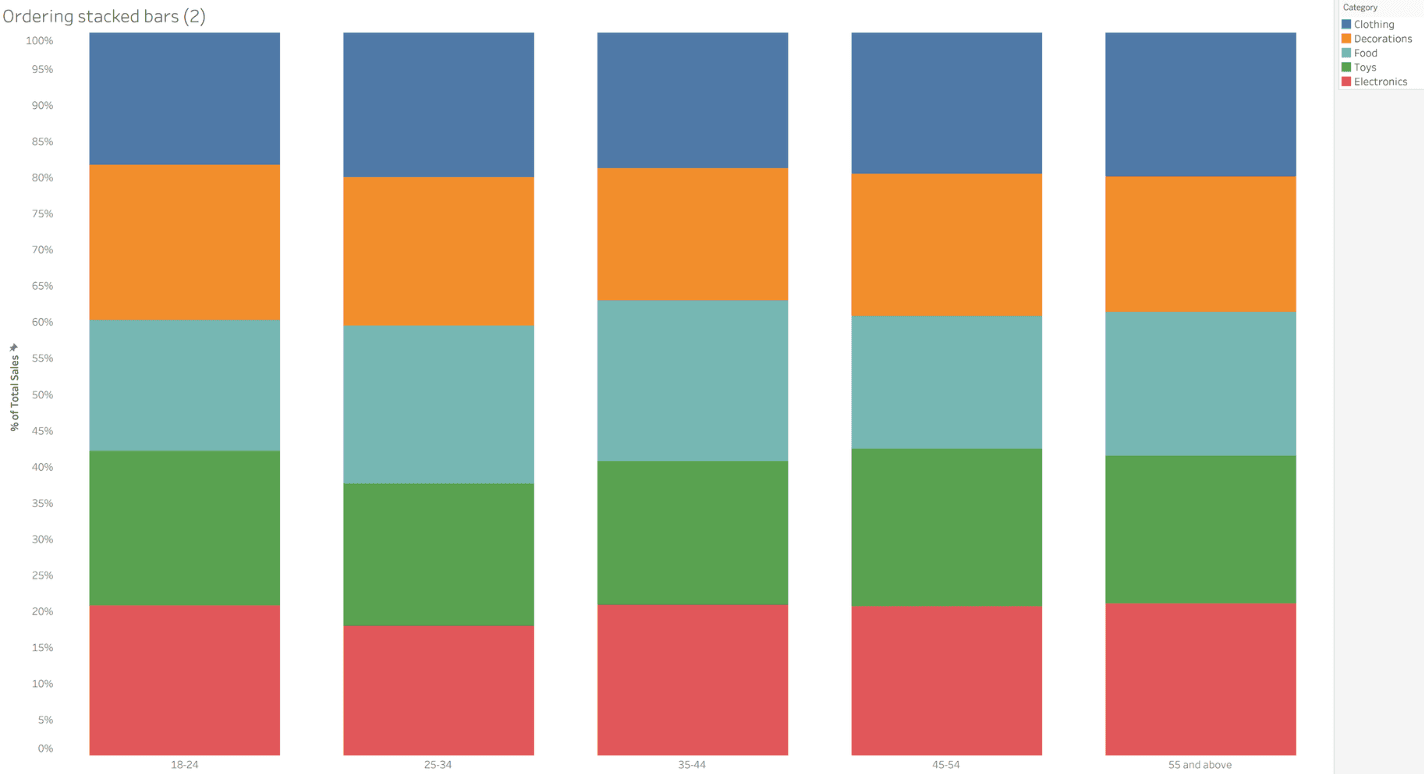
Ordering a stacked bar chart in Tableau
Want to Get Latest Updates and Tips on Tableau Bites Blogs
Sign Up For Newsletter


