
For the love of all things “MECE”….
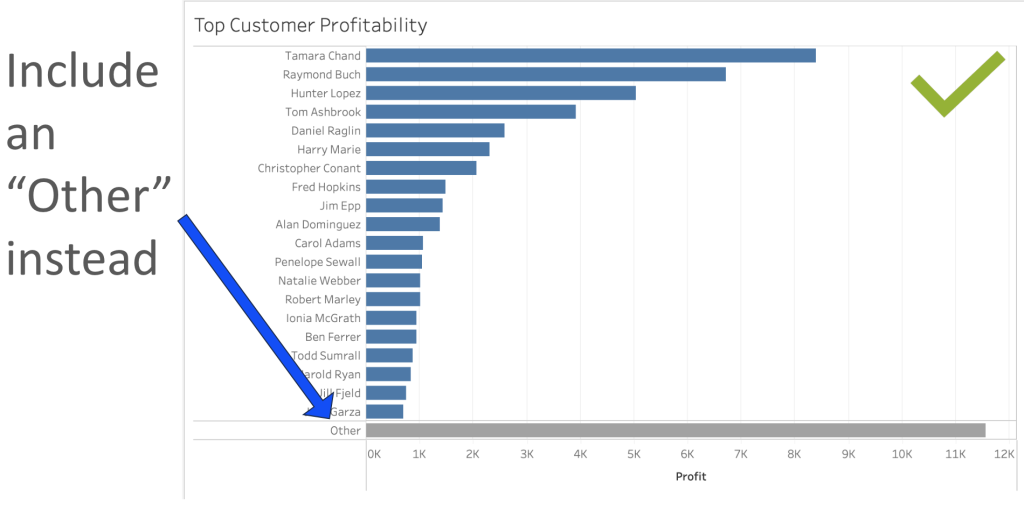
…OK, yes you do want to filter to drill down, absolutely. But you often want to start off with the whole story in mind. Try and avoid filtering out data just to get it to fit on the page. There are many ways to do this.
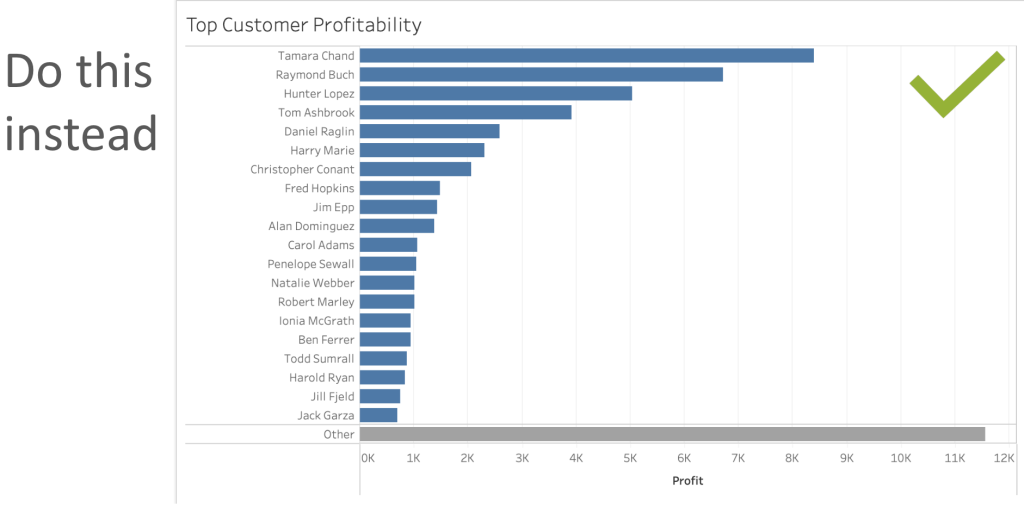
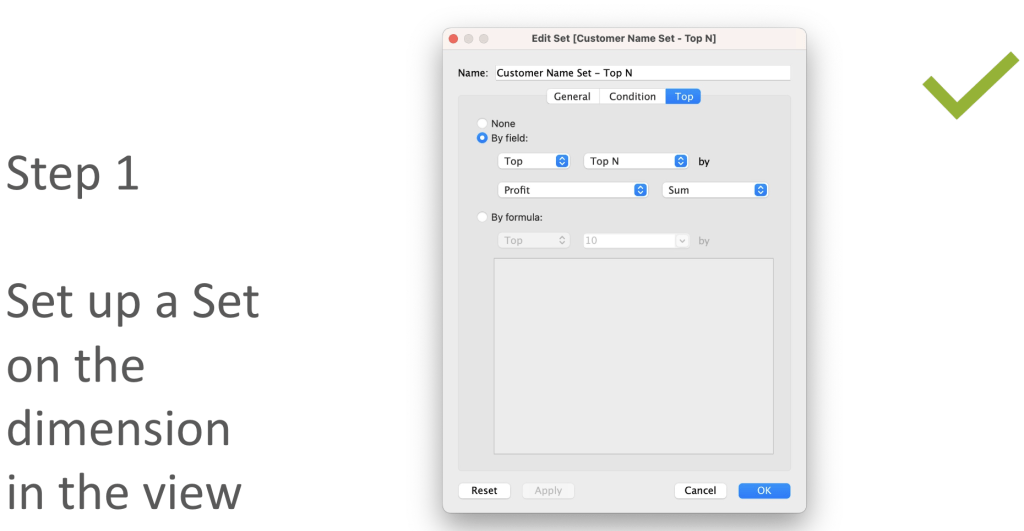
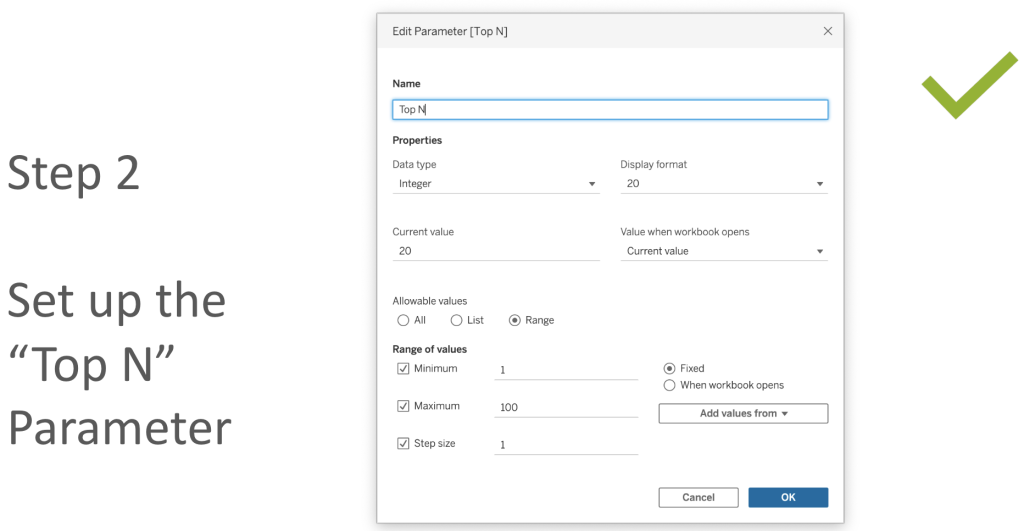
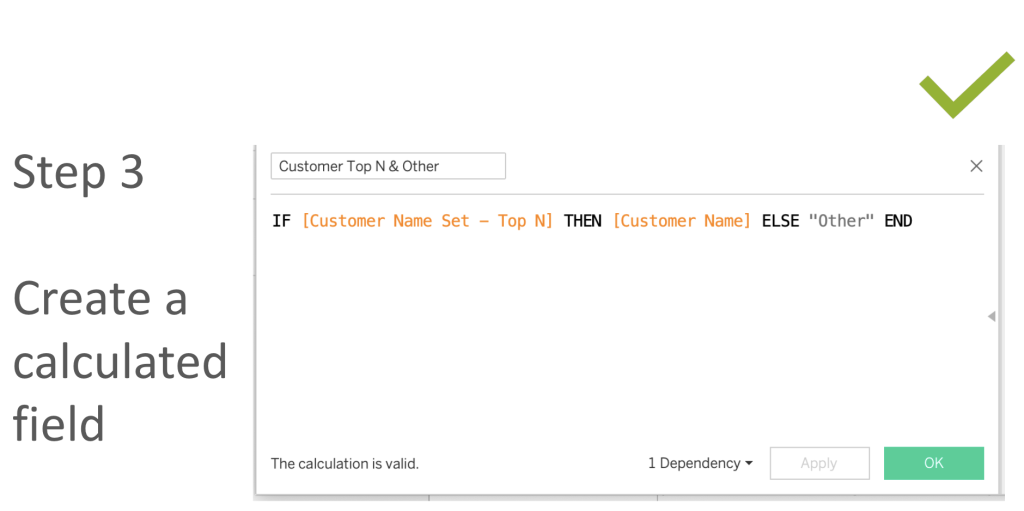
One of the easiest ways is what I refer to now as the “Ryan Sleeper Top N and Other” – not for any other reason than it was his original blog post many years ago that exposed me to the #DataFam community and all the golden nuggets that it can reveal.
It was one of the earliest blogs I included when I created this “Tableau Bites” Newsletter!
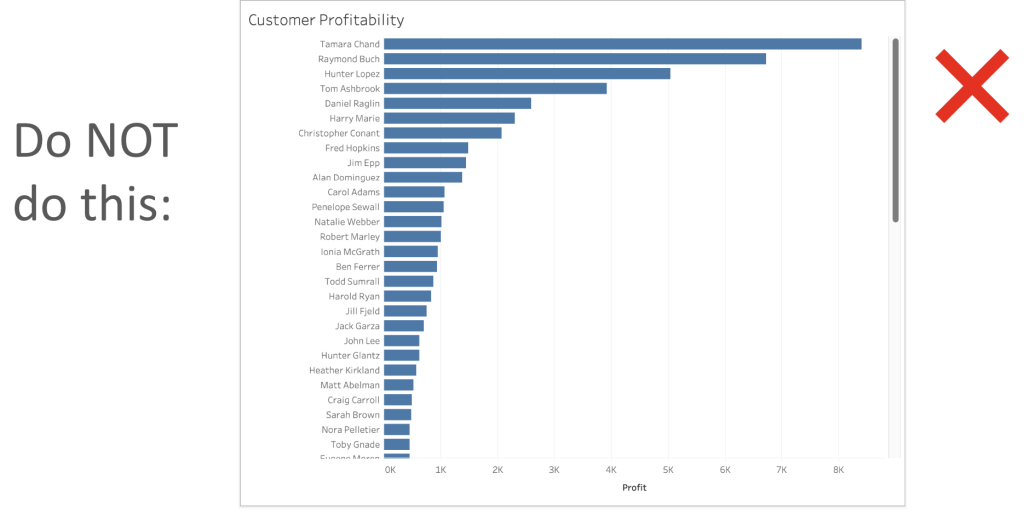
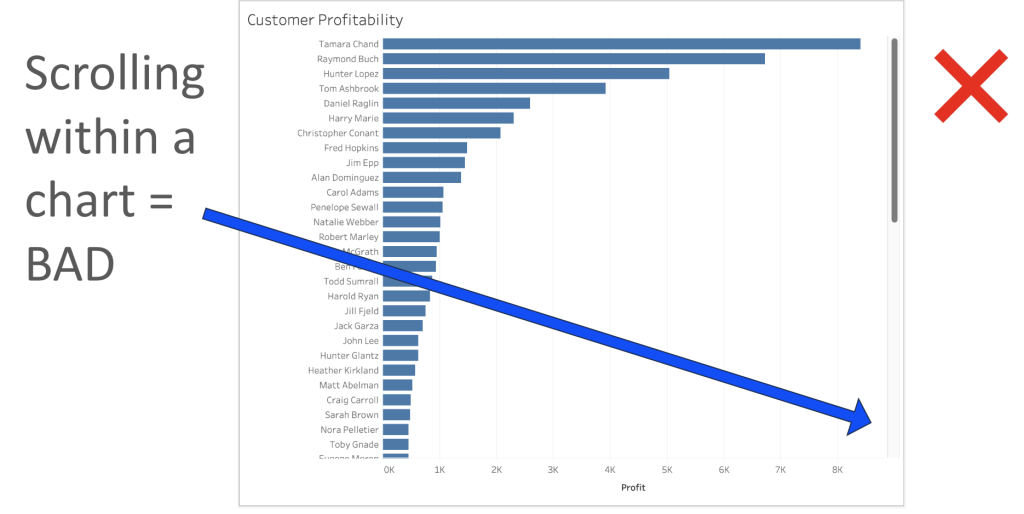
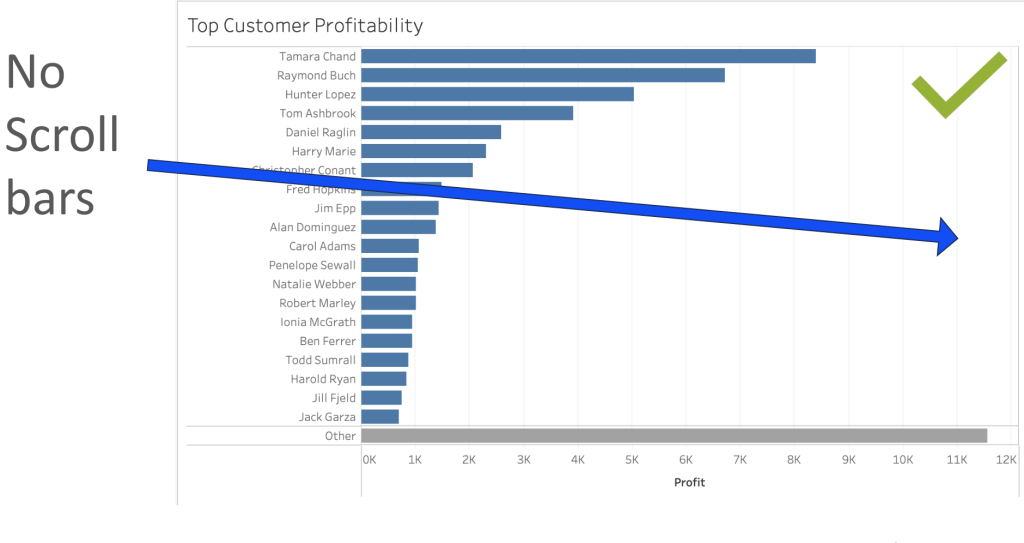
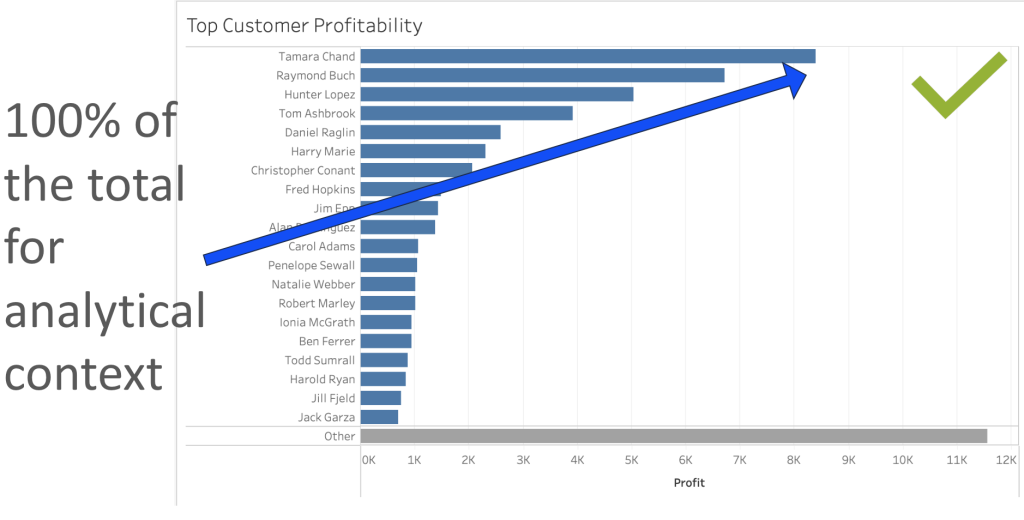
It helps you remove the scroll bar whilst starting out by looking at all the data. Of course, if the number of elements is large and the tail is long….then the “Other” is large compared to the Top N – but therein lies part of the story, surely.
Barbara Minto developed the principle of “MECE” – “Mutually Exclusive and Collectively Exhaustive” – while she was at McKinsey & Co., way back in the 1960s – but she attributes the idea as far back as Aristotle. Way to go, dude.
It’s a useful principle to think of in your dashboard design and another way to discuss why scroll bars should be avoided in most instances. Especially within one chart on a dashboard.
The same rationale is true for why most business dashboards should be kept to one page. More so if they are exploratory in nature.
You don’t want your user to click on an object to filter the dashboard, and not see the whole impact.
I was first introduced to the MECE principle many moons ago, when studying for the IBCS – International Business Communication Standards certification exam.
Principles that help me guide many a dashboard TToT™️ 3D coaching session on Design, Develop and Deliver.
Take a look at the original blog from Ryan Sleeper below!
I’d love to know what other techniques you use to ensure that the whole picture is the starting point of your users analytical journey…


