Blake Feiza explores the power of map layers in Tableau – a technique allowing you to seamlessly combine spatial data with distribution analysis, making it easier to uncover trends and patterns in your dataset. Whichever area you’re working in, this method helps you add depth to your dashboards.
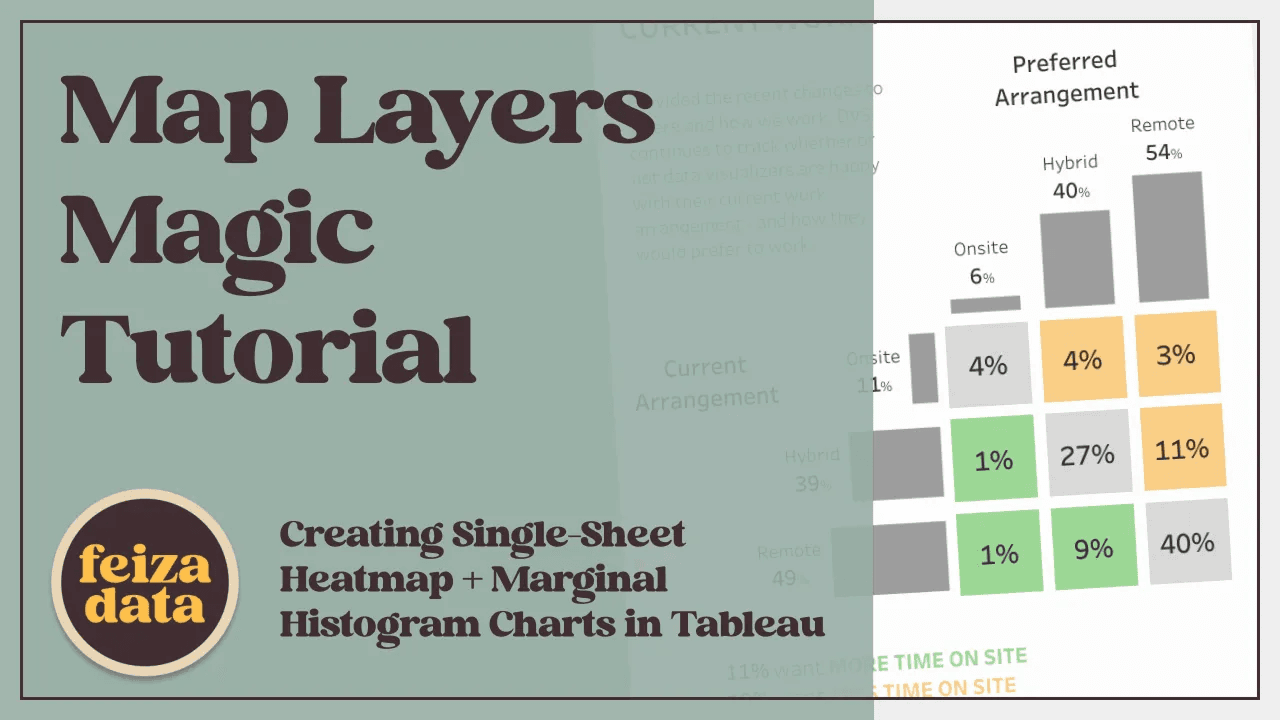
Beyond showcasing the technique, Blake provides clear, step-by-step guidance, ensuring that both beginners and advanced users can implement this approach with ease. The combination of heatmaps and histograms enhances storytelling by providing a dual perspective – where your data is located and how it’s distributed. An article packed with valuable insights!


